
Figures & data
Table 1. Data example
Table 2. The framework for assessing impact HSR
Table 3. The index list
Figure 1. Cities and rails
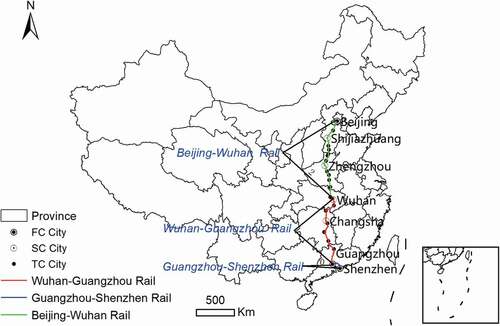
Table 4. The cities located in Beijing-Shenzhen HSR line
Figure 2. Number of posts of “JW” cities and “WG” cities
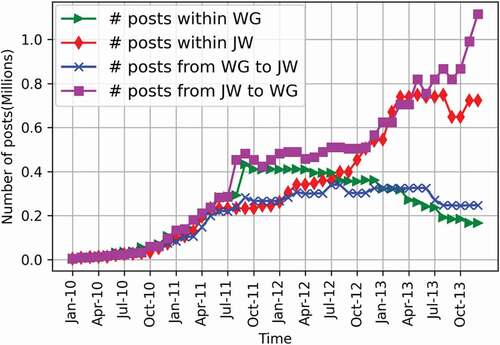
Table 5. The difference in post numbers in Beijing and Shenzhen over four years
Figure 3. Difference between population and the number of local posts in four years from 24 cities
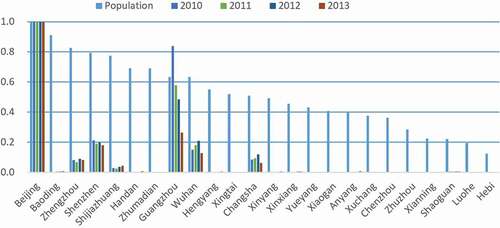
Figure 4. The distribution of Cij.
Table 6. In-awareness index and out-awareness index
Figure 5. (a) The difference (IAI- OAI) of cities between IAI and OAI in 2010. (b) The difference (IAI- OAI) of cities between IAI and OAI in 2013
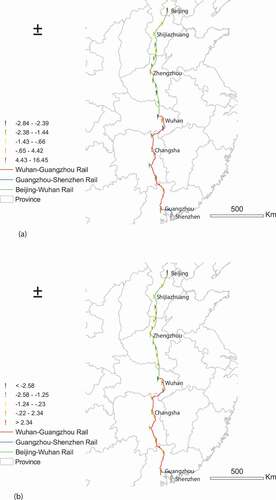
Table 7. Comparison IAI and OAI between in seven central cities
Figure 6. SIAI and SOAI from 2010 to 2013
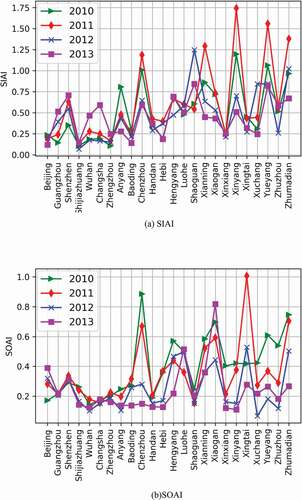
Table 8. Comparison of SIAI between the central cities and TC cities
Figure 7. SIAI and SOAI differences from 2010 to 2013
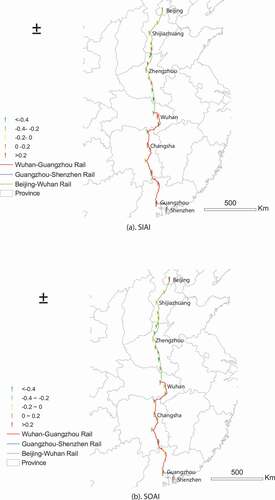
Figure 8. The improvement of SIAI and SOAI between 2010 to 2013 within given hours
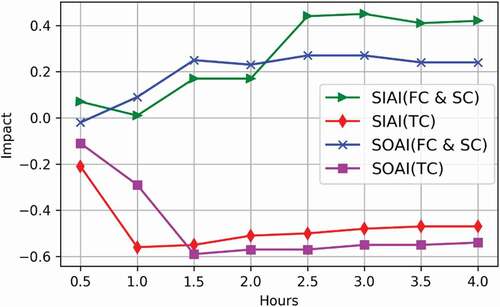
Table 9. TE and TS indices from 2010 to 2013
Data availability statement
The data that support the findings of this study are available from the corresponding author, X. Ye, upon reasonable request. https://github.com/jfgong1/HSRcities/blob/main/cites-release.csv