
Figures & data
Table 1. A part of built or under construction of LEO constellations
Figure 1. Conception of LeGNSS operating mechanism.
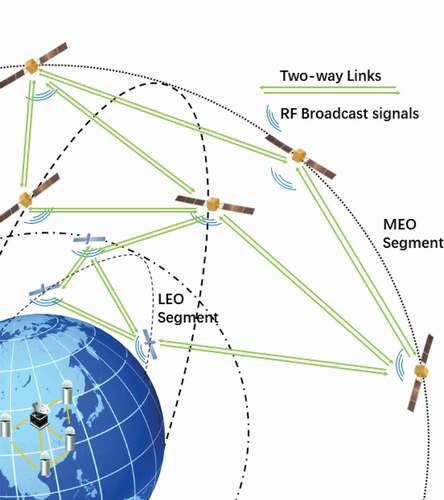
Figure 2. Distribution of the visible number, availability of LEO satellites, and GDOP values along the latitude direction before (left) and after (right) the optimization of LEO constellations with 120, 150, 180, and 240 LEO satellites, respectively.
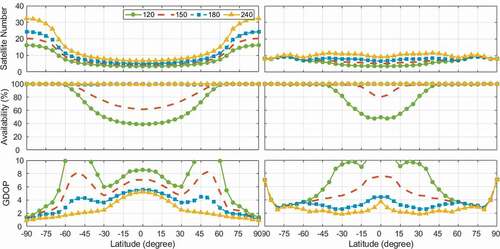
Table 2. LEO satellite constellation design configuration (w/o means constellation without optimization; w means constellation with optimization, i denotes orbit inclination, t denotes number of satellites in Walker constellation, p denotes the number of equally spaced orbit planes, and f denotes the relative spacing between satellites in adjacent orbit planes)
Figure 3. GPS/BDS navigation satellite orbit and clock results without (left) and with (right) partial LEO satellites.
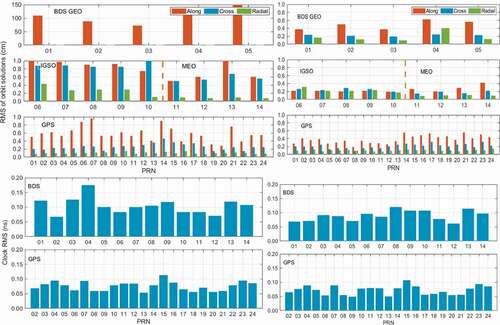
Figure 4. LEO orbit and clock determination without (left) and with (right) ground LEO observations.
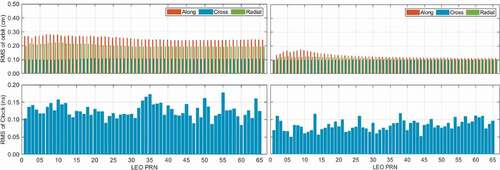
Figure 5. Comparison of GPS/BDS/LEO PPP east/north/up convergence time under different sampling intervals with 66 LEO satellites. The black dashed line represents the 95% global station convergence time (from top to bottom is 30 s, 10 s, 5 s, and 1 s, respectively).
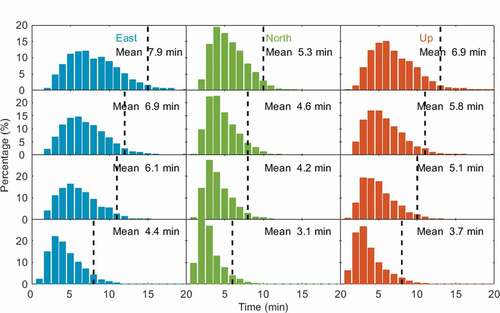
Figure 6. Vertical (top) and horizontal (bottom) convergence time comparison of high-latitude (left), mid-latitude (middle), and low-latitude (right) stations before and after LEO satellite constellation optimization with 120, 150, 180, and 240 LEO satellites (Ge et al. Citation2020b).
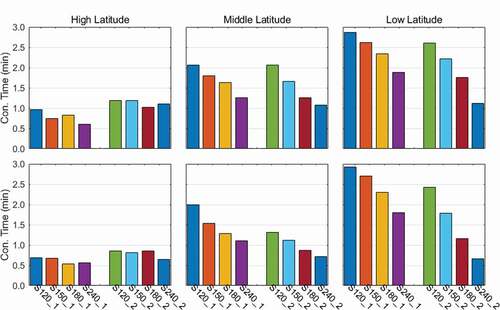
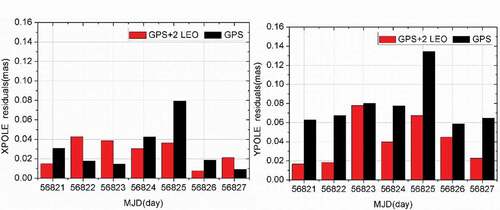
Figure 7. The influence of LEO satellites on the calculation of the earth’s rotation parameters.
Data availability statement
Raw data were generated at Tongji University. Derived data supporting the findings of this study are available at https://gnss.tongji.edu.cn/info/1023/1447.htm or from the corresponding author [email protected].