
Figures & data
Figure 1. An example of DDM onboard SGR-ReSI instrument.
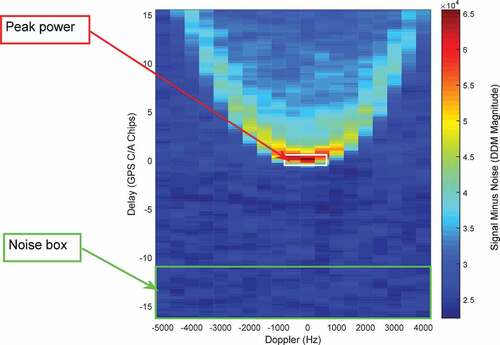
Figure 2. An example of a noisy DDM retrieved by the SGR-ReSi instrument.
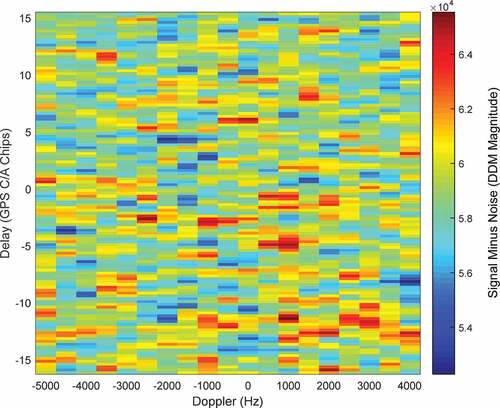
Figure 3. TDS-1 SNRc with SNRs >0 dB and the corresponding ASCAT wind speeds for the training dataset (75% of samples) of all GPS blocks in (a) and each GPS block in (b)–(f). The white curve represents GMF. The form of GMF is , where
represents SNRc.
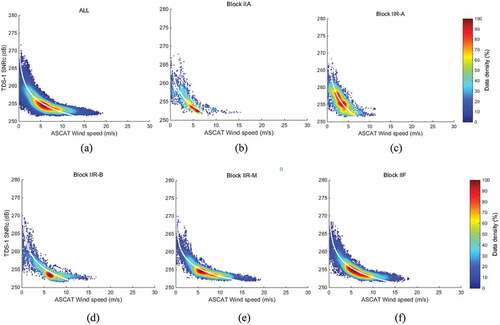
Figure 4. (a)–(f) The wind speed retrievals of TDS-1 versus collocated ASCAT wind speed for the remaining test dataset (25% of samples) of all GPS blocks and each GPS block. The black line represents TDS-1 wind speed equal to ASCAT wind speed.
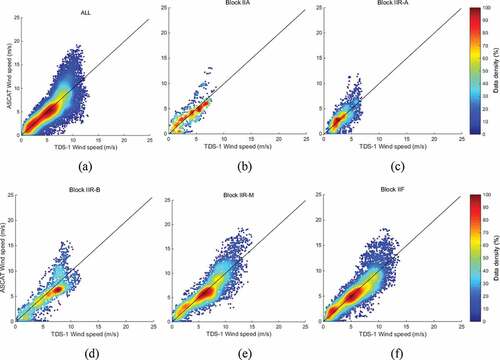
Figure 5. TDS-1 SNRc with SNRs >0 dB and the corresponding ECMWF wind speeds for the training dataset (75% of samples) of all GPS blocks in (a) and each GPS block in (b)–(f). The white curve represents GMF. The form of GMF is , where
represents SNRc.
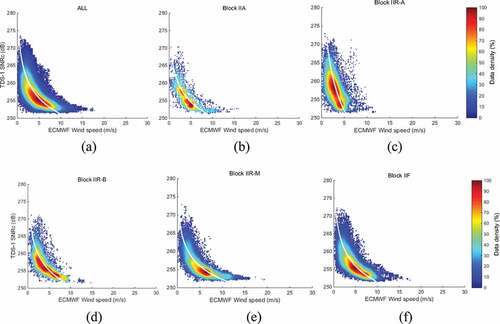
Figure 6. The wind speed retrievals of TDS-1 and the corresponding ECMWF wind speed for the remaining test dataset (25% of samples) of all GPS blocks in (a) and each GPS block in (b)–(f). The black line represents TDS-1 wind speed equal to ECMWF wind speed.
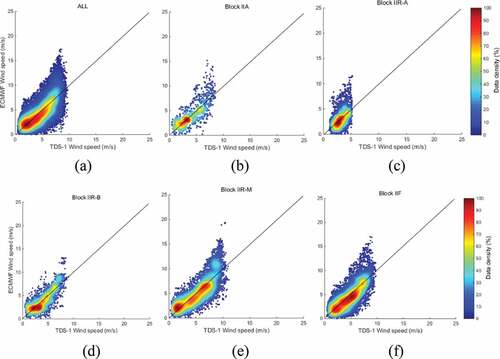
Table 1. Performance of each GPS block against ASCAT and ECMWF at high SNR
Figure 7. TDS-1 SNRc with SNRs ≤ 0 dB and SNRs > −10 dB and the corresponding ASCAT wind speeds for the training dataset (75% of samples) of all GPS blocks in (a) and each GPS block in (b)–(f). The white curve represents GMF. The form of GMF is , where
represents SNRc.
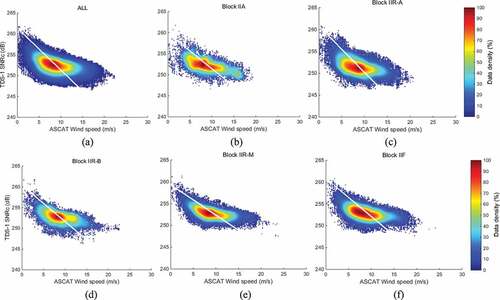
Figure 8. The wind speed retrievals of TDS-1 and the corresponding ASCAT wind speed for the remaining test dataset (25% of samples) of all GPS blocks in (a) and each GPS block in (b)–(f). The black line represents TDS-1 wind speed equal to ASCAT wind speed.
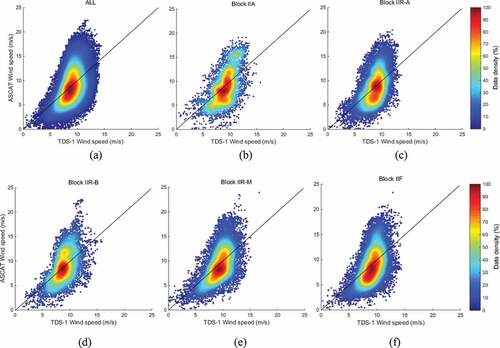
Figure 9. TDS-1 SNRc with SNRs ≤ 0 dB and SNRs > −10 dB of the corresponding ECMWF wind speeds for the training dataset (75% of samples) of all GPS blocks in (a) and each GPS block in (b)–(f). The white curve represents GMF. The form of GMF is , where
represents SNRc.
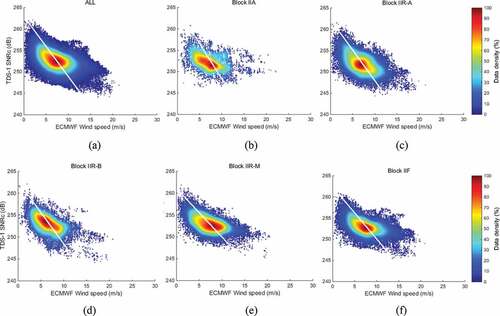
Figure 10. The wind speed retrievals of TDS-1 and the corresponding ECMWF wind speeds for the remaining test dataset (25% of samples) of all GPS blocks in (a) and each GPS block in (b)–(f). The black line represents that TDS-1 wind speed is equal to ECMWF wind speed.
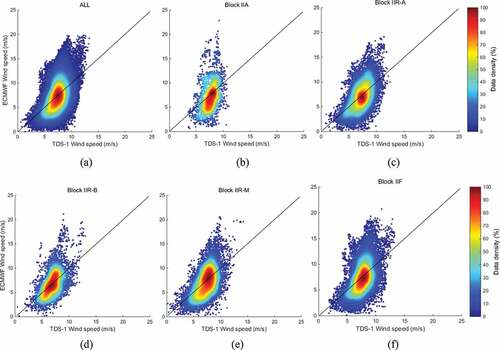
Table 2. Performance of each GPS block against ASCAT and ECMWF at low SNR
Figure 11. (a) Relationship between Hs and SNR collocated with ECMWF. (b) Relationship between ECMWF wind speed and mean SNR.
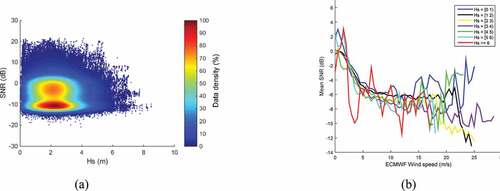
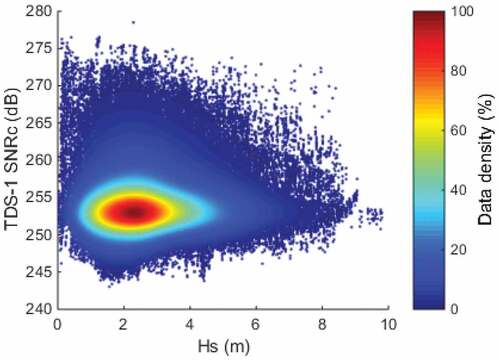
Figure 12. Relationship between ECMWF Hs and SNRc.
Data availability statement
The TDS-1 dataset is available at http://merrbys.co.uk/. The ASCAT dataset is available at https://podaac.jpl.nasa.gov/. The ECMWF dataset is available at https://www.ecmwf.int/.