
Figures & data
Figure 1. An e
xample of a road segment and an intersection.
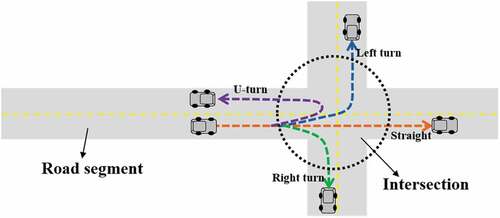
Figure 2. Data density difference between road intersections and segments.
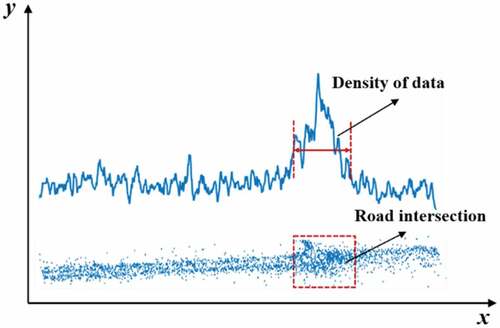
Figure 3. An example of the resampling process.
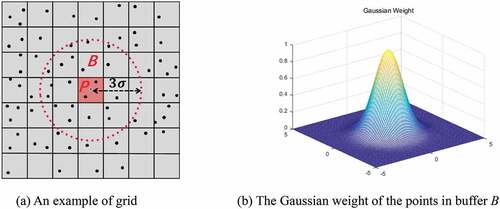
Figure 4. The result of resampling in a crossroad.
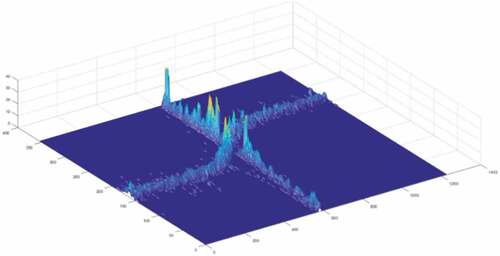
Figure 5. An example of a gamma-correction-based spatiotemporal prediction algorithm.
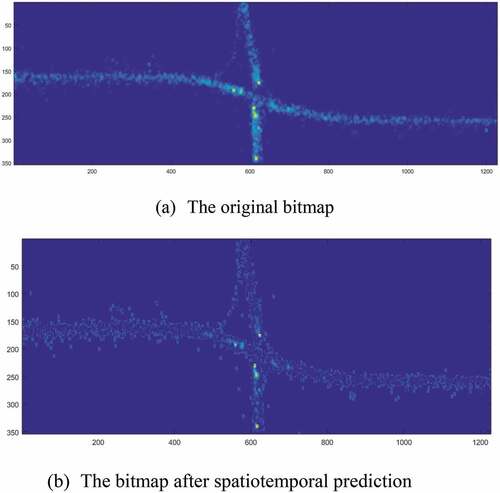
Figure 6. The result of Otsu.
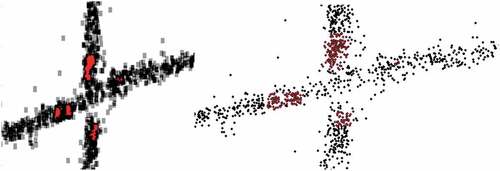
Figure 7. Clothoid-based trajectory resampling.
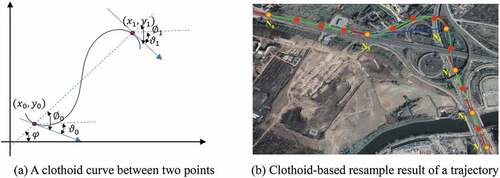
Figure 8. An example of two associated trajectories.
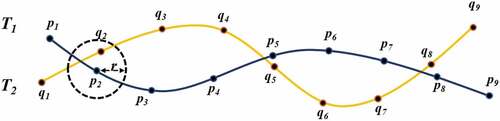
Figure 9. Different scenarios for .
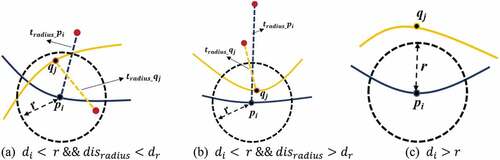
Figure 10. An example of a rectangular fitting region.
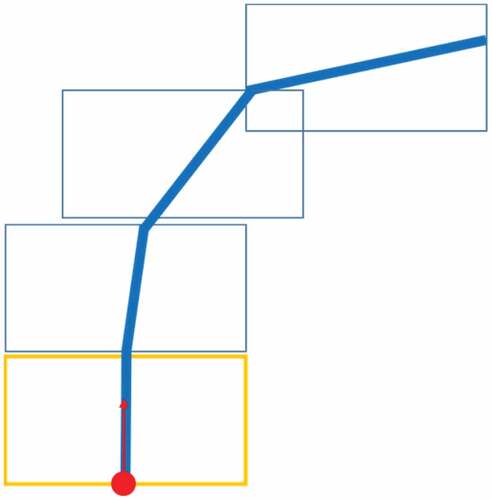
Figure 11. An example of weighted least squares fitting.
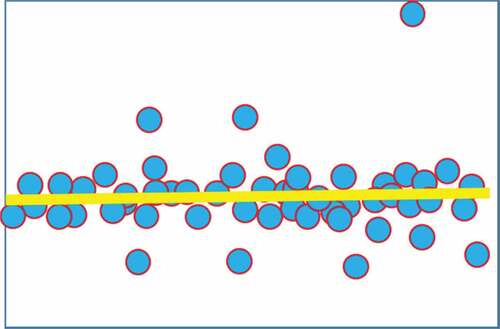
Figure 12. An example of building a road network.
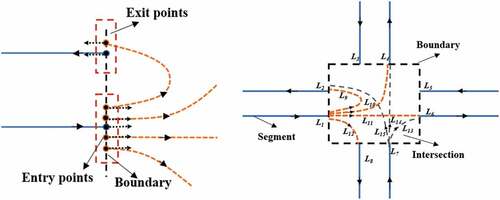
Figure 13. The experimental floating car data.
Table 2. The parameter setting values
Figure 14. The results of intersection detection in data 1.
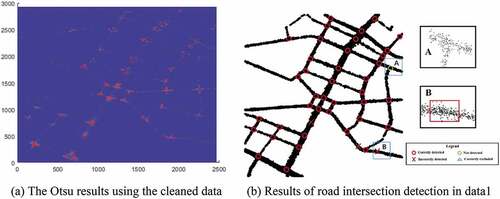
Figure 15. The results of intersection detection in data 2.

Figure 16. The results of clustering in different road intersections.
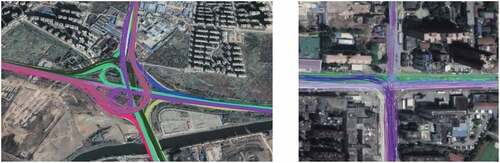
Figure 17. Centerline extraction results of data 1.
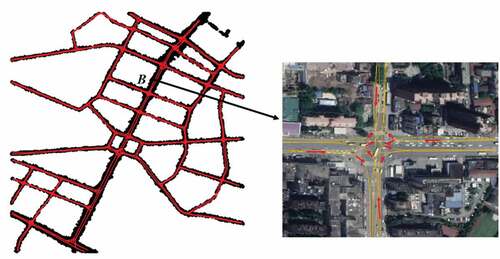
Figure 18. Results comparison of intersection detection.
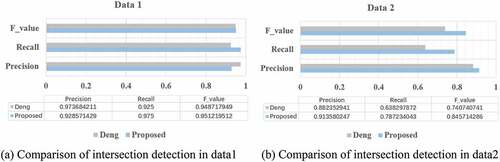
Figure 19. Results comparison of centerline extraction.
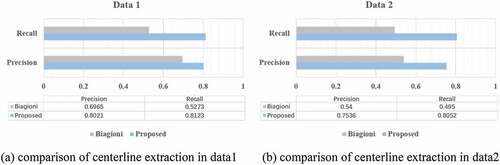
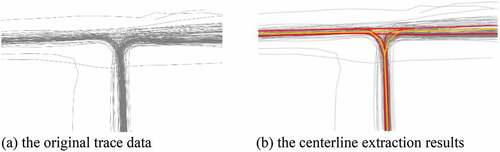
Figure 20. Results comparison of centerline extraction. Red lines represent the results of our method, and the yellow lines are the results of Biagioni.
Data availability statement
The data that support the findings of this study are available from DF GO. DF GO is a mobility technology platform. It offers app-based services including taxi-hailing. Restrictions apply to the availability of these data, which were used under license for this study. Data are available with the permission of DF GO (www.dfcx.com.cn).