
Figures & data
Figure 1. Geographical scheme of the Apatity test site.
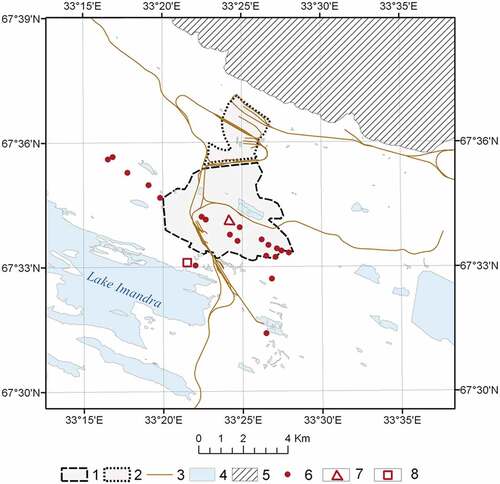
Figure 2. ASTER digital elevation model.
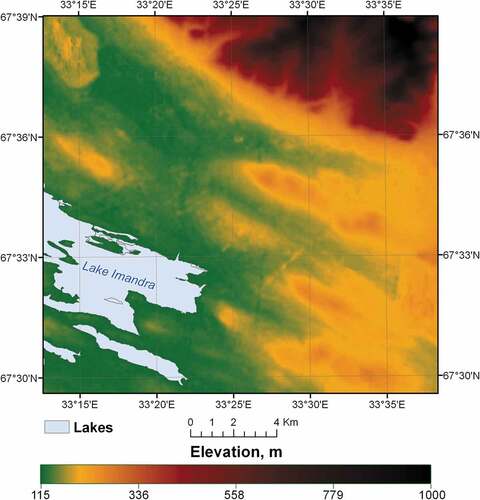
Figure 3. Air temperature variations. The arrow indicates the long period of calm weather under astronomical polar night conditions.
Table 1. Satellite data.a
Figure 4. Map of TS(x,y) – the land surface temperature retrieved from Landsat 8 satellite image. Time: ~09:00 GMT; Date: 07.03.2018.
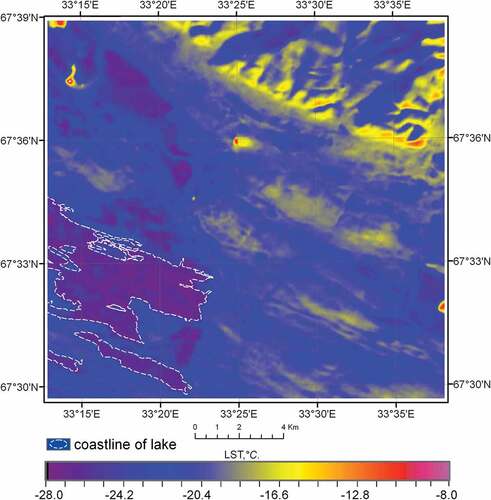
Figure 5. Correlation between the air temperature and the surface temperature. Temperature data in the plots are those observed at the satellite shooting moments indicated in .
Figure 6. Map of R(x,y) – coefficients of correlation between TS(x,y,τ) (Landsat) and ; τi is the time of i-th satellite shooting. Date: 01.02.2018.
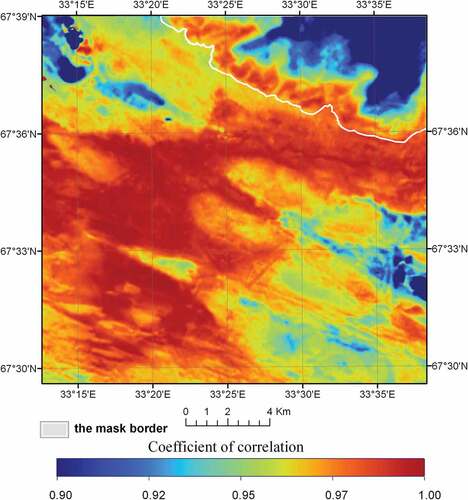
Figure 7. Maps of coefficients of EquationEquation (4)(4)
(4) , compiled from the results of multiple satellite imagery () and of the standard observations at WMO 22213 weather station.
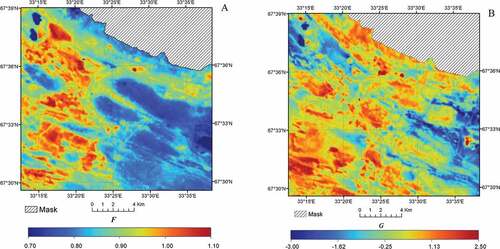
Figure 8. Map of air temperature, compiled on the base of the satellite and WMO weather station data. Time: 00:00 GMT; 01.02.2018. This time is between the times of satellite surveys (see ).
Legend: 1 – mask; 2 – roads; 3 – proposed new districts; 4 – proposed highways interconnecting the new districts. A - CHP plant; B - municipal wastewater treatment plant; C and D – lowlands.
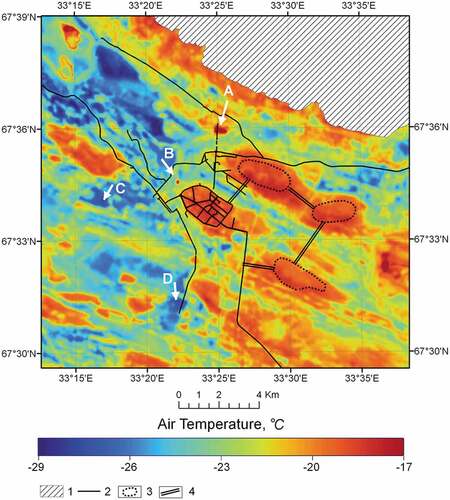
Figure 9. Dependence of errors σ on the relief altitude.
Supplemental Material
Download MS Word (4.8 MB)Data availability statement
The raw land surface temperature data can be obtained from the LAADS DAAC – NASA (Level-1 and Atmosphere Archive and Distribution System Web Interface). https://ladsweb.modaps.eosdis.nasa.gov