
Figures & data
Figure 1. (a) Study areas, showing the SAR images and GPS stations, base map is a gray shade Digital Elevation Model (DEM), (b) Google earth image showing the vegetation cover.
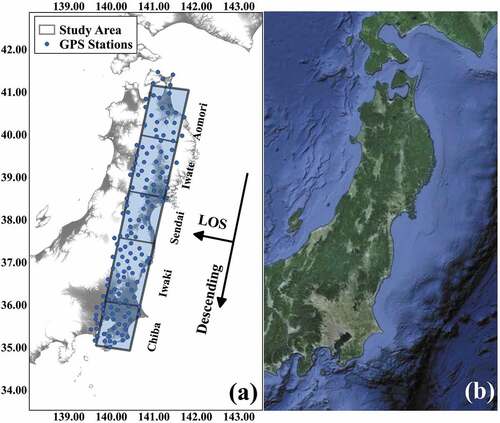
Table 1. Details of InSAR stack
Figure 2. Spatial coherence vs temporal correlation.
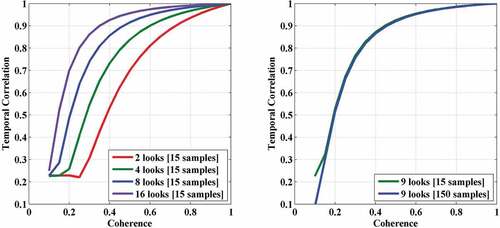
Figure 3. Methodology block diagram.
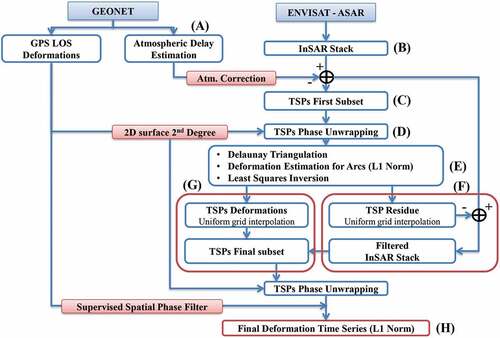
Figure 4. Atmospheric wet delay () vs altitude.
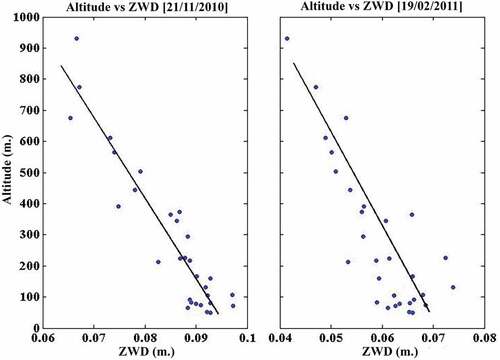
Figure 5. Atmospheric correction and DEM.
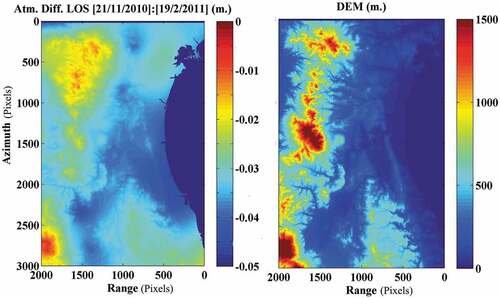
Figure 6. Analysis of Sendai region (a) TCPs, (b) TSPs first subset. (c) Phase temporal correlation. (d) Coseismic interferogram before applying GPS fringe reduction and (e) after, (f) the corresponding final unwrapped phase map.
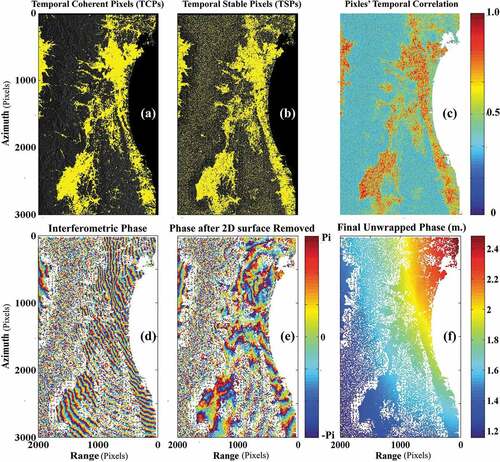
Table 2. Pixels density and coverage index
Figure 7. InSAR stack structure.
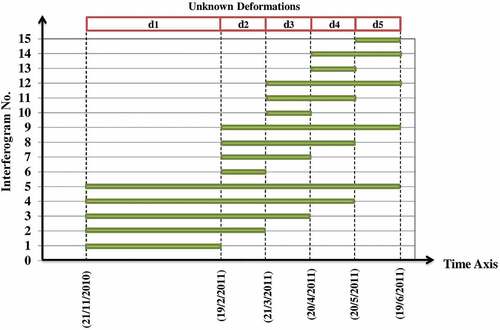
Table 3. Number of temporal stable pixels final subset
Figure 8. TCPs and TSPs first subset in Aomori, Iwate, Iwaki, and Chiba regions.
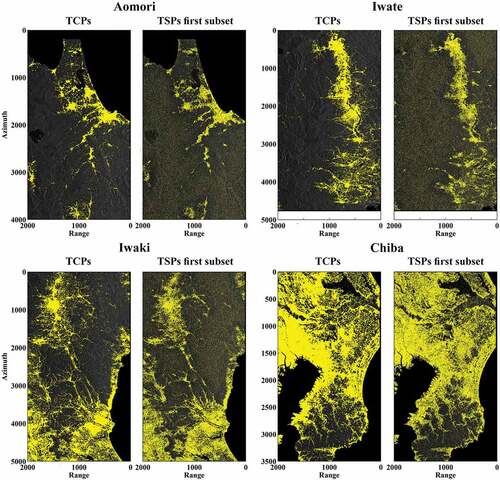
Figure 9. Final deformation maps for study areas and DEM error.
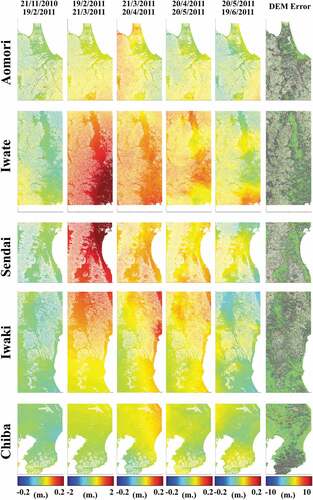
Figure 10. Estimated InSAR deformations vs observed GPS deformations, (a) Iwate region, (b) Iwaki region, and (c) Chiba region.
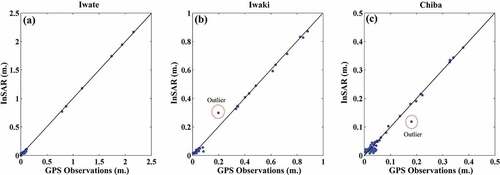
Table 4. Statistical analysis of the accuracy check
Data availability statement
The data that support the findings of this study are openly available in Geospatial Information Authority of Japan (GSI) at [https://www.gsi.go.jp/ENGLISH/] and European Space Agency at [https://earth.esa.int/eogateway/].