
Figures & data
Figure 1. GRACE satellite SBF definition (Doornbos Citation2012).
Table 1. Processing strategy in aspects of dynamic models and observation models
Figure 2. GRACE-A satellite orbit differences with respect to the JPL PSO. Different colors demonstrate different accelerometer bias parameterization.
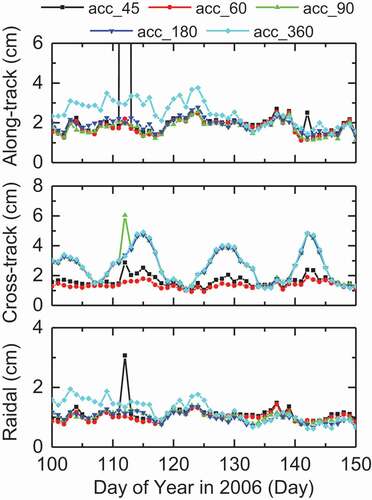
Table 2. GRACE-A satellite orbit precision with respect to the JPL PSO and SLR OMC statistics with different accelerometer bias parameterization
Figure 3. Estimated Bx, By, Bz parameters during DOY 100–150 in 2006 with different parameterizations.
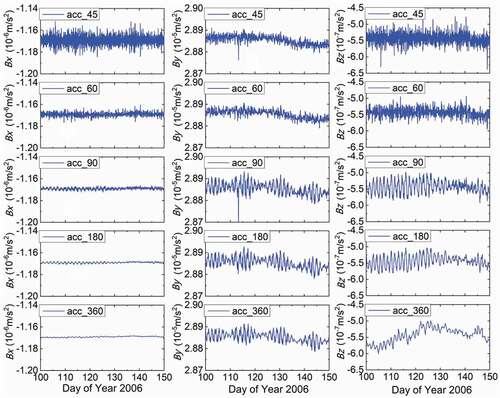
Table 3. The mean and STD values of estimated Bx, By, Bz parameters during DOY 100–150 in 2006
Figure 4. GRACE-A satellite orbit precision for POD and orbit-fitting schemes in along-track, cross-track, and radial components with respect to JPL PSOs.
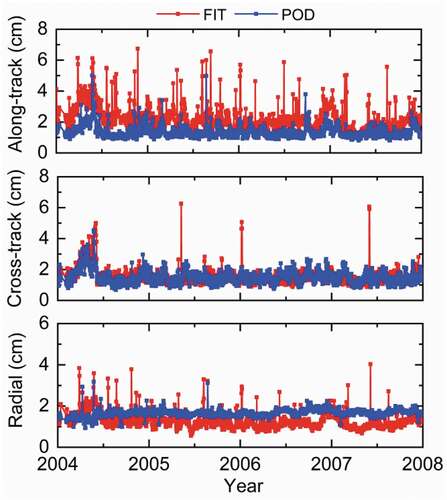
Table 4. GRACE-A satellite orbit precision statistics during 2004–2007
Figure 5. SLR OMC mean and STD values of GRACE-A satellite during 2004 and 2007.
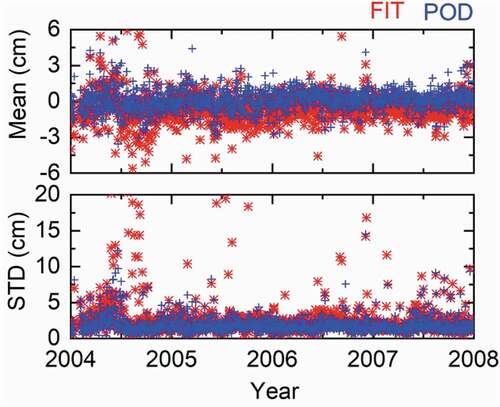
Figure 6. GRACE-A satellite bias parameter series during 2004–2007.
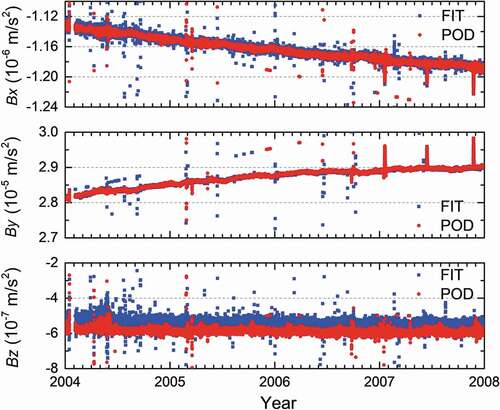
Figure 7. Bias parameter difference series between the orbit-fitting and POD schemes for GRACE-A satellite.
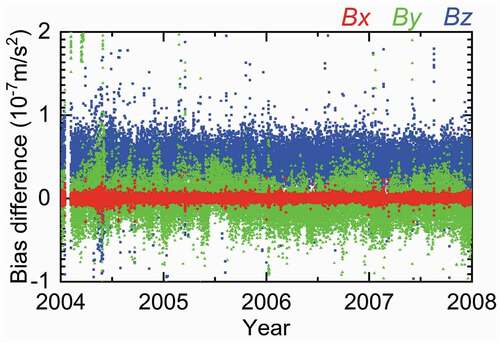
Table 5. GRACE-A satellite bias parameter differences between the orbit-fitting and POD schemes
Figure 8. Density series of the HASDM model, NRLMSISE00 model, POD, orbit fitting, and Density_Direct on DOY 002, 2004.
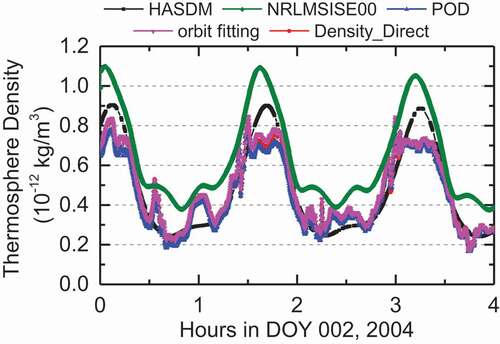
Table 6. Density ratio statistics of NRLMSISE00, HASDM, and Density_Direct over POD and orbit-fitting-derived densities on DOY 002, 2004
Figure 9. Frequency count of density ratios of orbit fitting over POD densities and its log-normal distribution fit. The bin interval for the frequency count is 0.01.
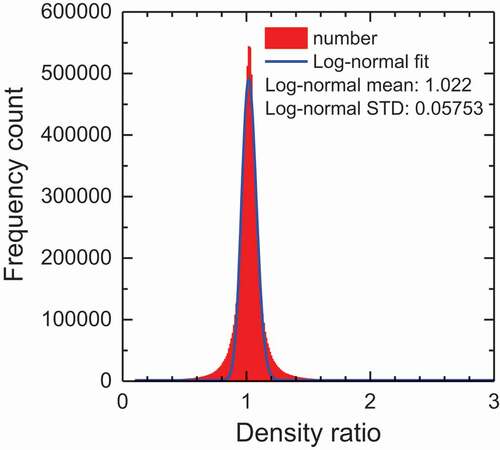
Table 7. Log-normal distribution fit to density ratios of NRLMSISE00, HASDM, and Density_Direct to POD and orbit-fitting densities (all the density results during 2004 and 2007 are considered)
Data availability statement
All data included in this research are available upon request by contacting with the corresponding author by [email protected].