
Figures & data
Figure 1. Framework of urban function classification.
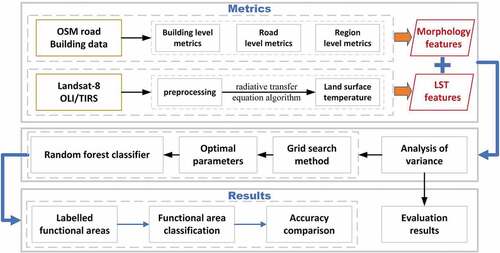
Table 1. Urban morphology metrics
Figure 2. Typical example of urban morphology index measurements.
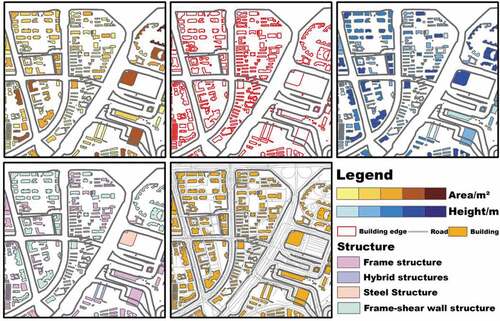
Table 2. Characteristic indexes of LST
Figure 3. Study area and experimental data.
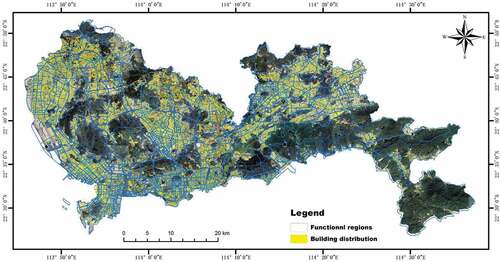
Figure 4. LST retrieval results and functional area.
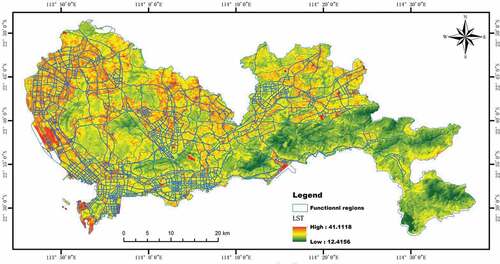
Figure 5. Box plots of urban morphology and LST metrics.
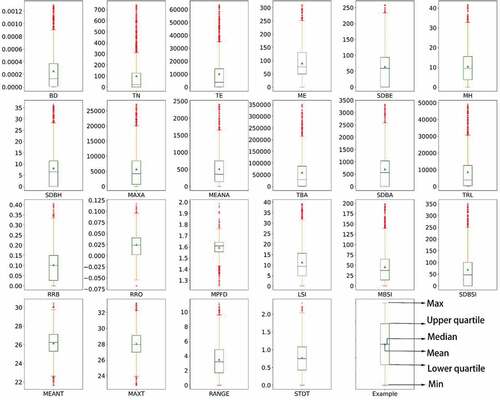
Table 3. The results of the variance analysis of urban morphological metrics and LST characteristics
Figure 6. Hyperparameter results using a grid search method.
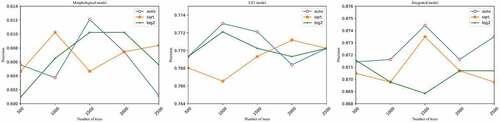
Figure 7. Functional area classification. (a) Actual classification. (b) Classification results based on urban morphology. (c) Classification results based on LST characteristics. (d) Classification results based on both the urban morphology and LST.
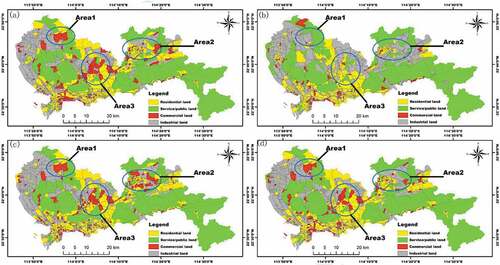
Table 4. Classification accuracy of urban functional areas based on morphological, LST, and integrated models
Figure 8. The relative importance of the features in the three models.
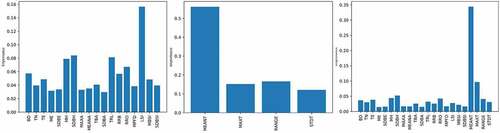
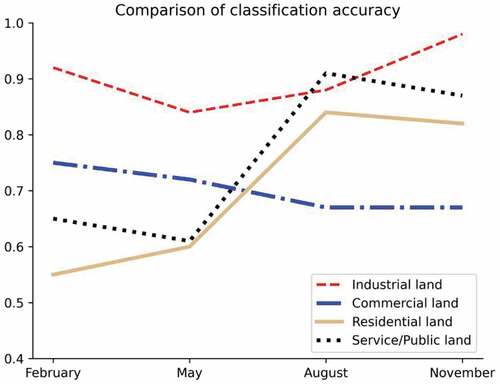
Figure 9. Comparison of the different LST times on classification accuracy.
Data availability statement
The data that support the findings of this study are available at [http://www.gscloud.cn/, https://www.openstreetmap.org/], These data were derived from the following resources available in the public domain: [http://www.gscloud.cn/, https://www.openstreetmap.org/]
The building and real functional area data that support the findings of this study are available from the corresponding author, [Hanfa Xing], upon reasonable request.