
Figures & data
Figure 1. Processing scheme for IAR POD of LEO satellites on GREAT software.
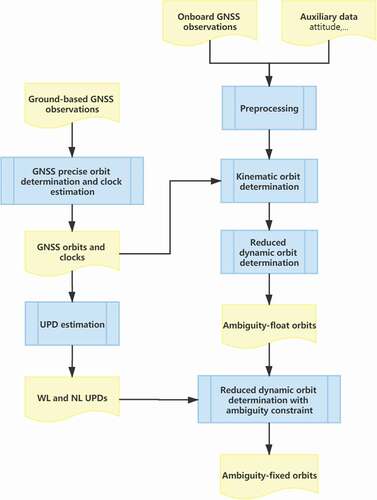
Table 1. Overview of satellites employed
Table 2. Reduced-dynamic POD strategy of LEO satellites
Figure 2. NL ambiguity fixing rates of POD IAR solutions for GRACE-FO, Swarm, Jason-3 and Sentinel-3 missions, in DOY 001–180, 2020. The red, green and blue colors indicate the fixed solutions computed with OSB, IRC and UPD products respectively. The average values are displayed in the top right corners in different colors. The data gap of GRACE-C covering DOY 038–042, GRACE-D covering DOY 018–022 and Jason-3 covering DOY 031–044, 168–171 in 2020 is due to the lack of observations.
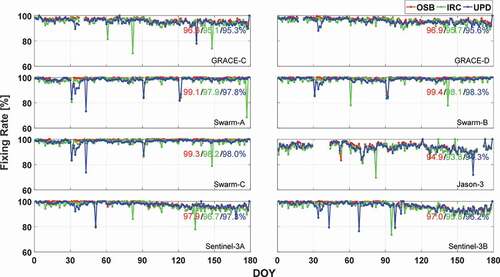
Figure 3. Distributions of the estimated WL (left) and NL (right) ambiguity residuals of GRACE-C IAR solutions in DOY 005, 2020. The mean and STD values of residuals are displayed in the top right corners.
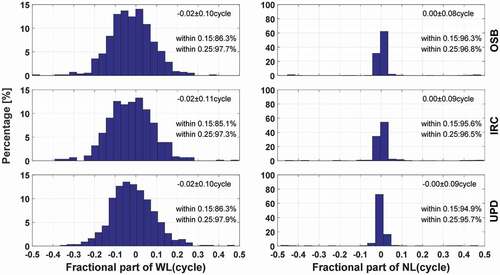
Table 3. The average 3D RMS values of differences between PSO products and our orbits derived from different solutions (Unit: mm)
Figure 4. Average RMS values of orbit differences of GRACE-FO, Swarm, Jason-3 and Sentinel-3 in along-track, cross-track, and radial directions (from top to bottom) in DOY 001–180, 2020. The red, green and blue colors indicate the OSB solutions, the IRC solutions and the UPD solutions respectively. The color bars without edges represent the ambiguity-float solutions, while the bars with black edges represent the ambiguity-fixed solutions.
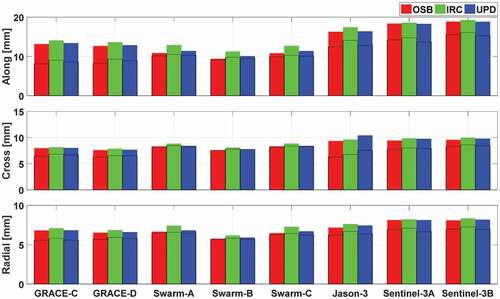
Table 4. The average RMS values of phase residuals of our orbits for different solutions (Unit: mm)
Table 5. The mean and STD values of SLR residuals of our orbits for different solutions (Unit: mm)
Figure 5. SLR residuals of ambiguity-fixed orbits for GRACE-FO, Swarm, Jason-3 and Sentinel-3 satellites, in DOY 001–180, 2020. The red, green and blue dots indicate the ambiguity-fixed solutions computed with OSB, IRC, and UPD products respectively. The mean and STD values are displayed in the top right corners in different colors.
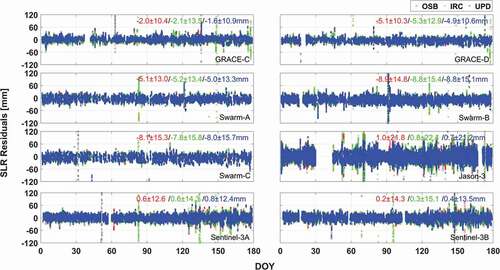
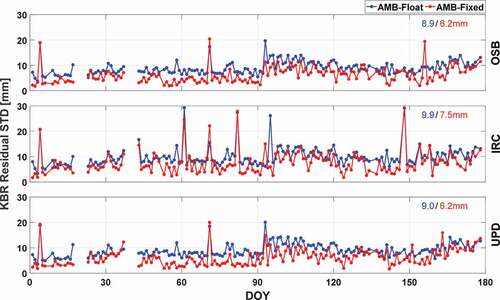
Figure 6. Daily KBR residuals STD of our GRACE-FO orbits for different solutions in DOY 001–180, 2020, with ambiguity fixed computed with OSB, IRC, and UPD products (from top to bottom) respectively. The blue and red colors indicate the ambiguity-float and ambiguity-fixed solutions respectively. The average values are displayed in the top right corners in different colors.
Data availability statement
We are grateful to International GNSS Service (IGS) for providing the precise orbit and clock products of GPS as well as OSB and IRC correction products at ftp://cddis.gsfc.nasa.gov for free. The UPD products generated by GREAT software can be accessed at http://igmas.users.sgg.whu.edu.cn/. The data onboard GRACE-FO, Swarm, Jason-3 and Sentinel-3 are publicly available from ftp://isdcftp.gfz-potsdam.de, ftp://swarm-diss.eo.esa.int, ftp://ftp-access.aviso.altimetry.fr and https://scihub.copernicus.eu respectively.