
Figures & data
Figure 1. The study area of Suzhou: (a) the study site in Jiangsu and (b) the four districts of study area Suzhou.
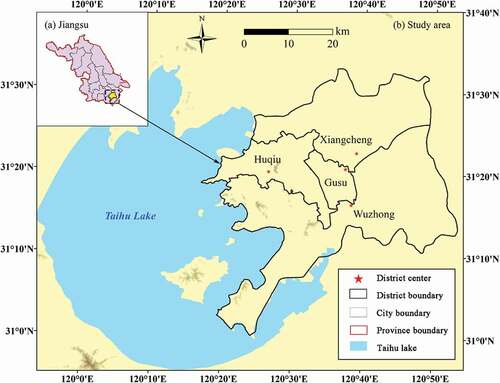
Figure 2. The vector formatted data of the facilities to extract the proximity driving factors.
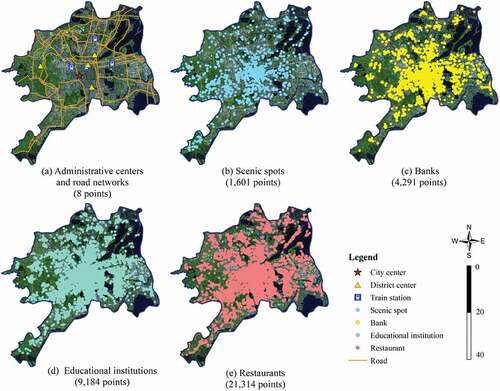
Table 1. The independent variables used to build the CAPSO models.
Figure 3. An example of the spatial representation of the point and line-like diving factors of different generalization scales.
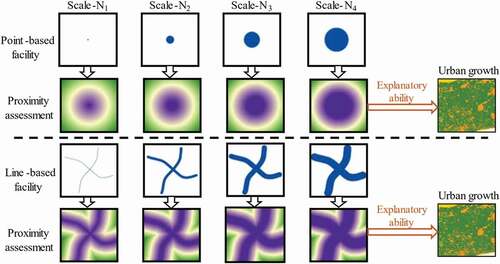
Figure 4. An example of bank factors represented at the 8 different generalization scales except for the Scale-0.
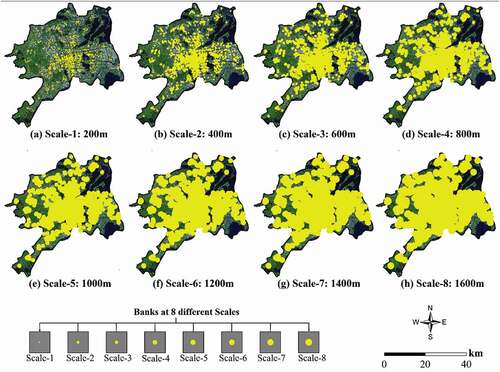
Figure 5. An example of driving factors (D-bank) at the nine generalization scales.
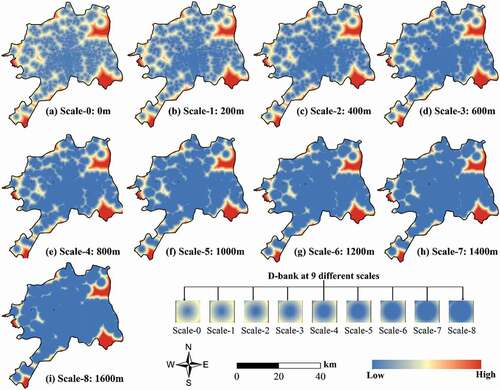
Table 2. The generalization scales used to extract the point and line-like driving factors.
Figure 6. The workflow of the factor effectiveness evaluation with the CAPSO model. (2020a: 2020 simulated from 2010, and 2020b: 2020 simulated from 2000).
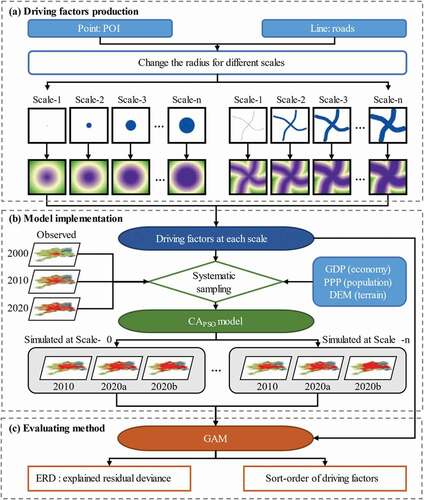
Table 3. The calculated CA parameters of the CAPSO models at the nine different scales.
Figure 7. (a) Land transition potential maps and their ROC curves at the nine scales; (b) the change in transition potential of four selected spots.
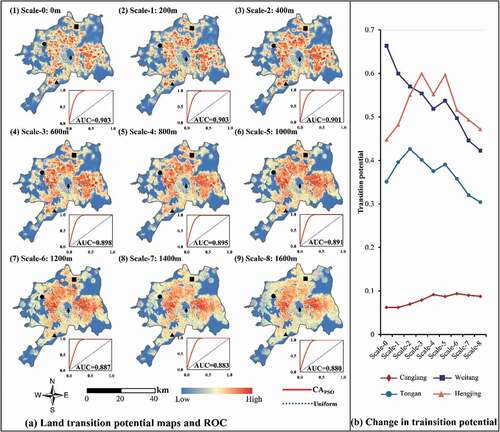
Figure 8. The distribution of the land transition potential at the nine scales.
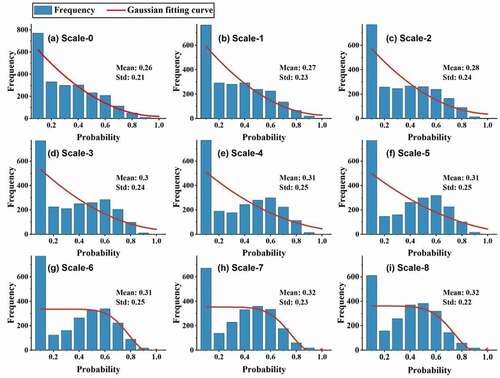
Figure 9. The observed and simulated urban growth during 2000–2020 with different driving factors at various scales.
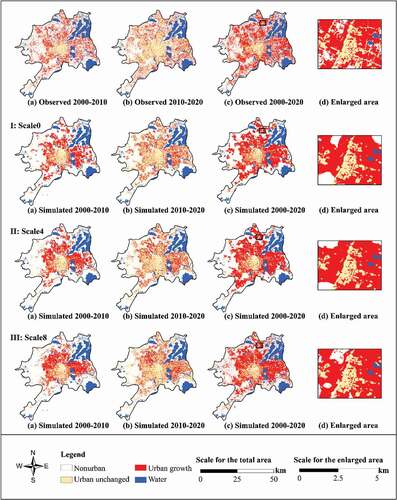
Figure 10. The simulation accuracy evaluation at the nine scales of the driving factors.
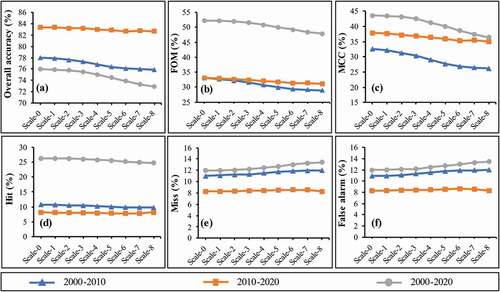
Figure 11. The ERD of the driving factors for simulating urban growth at the nine scales.
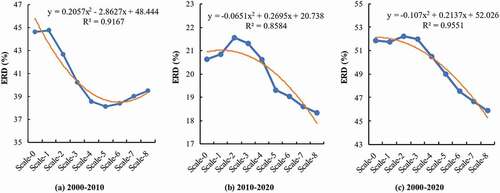
Table 4. The sort-order of driving factors at the nine scales in the three time-periods.
Data availability statement
The datasets and software used in this study are freely available at https://figshare.com/s/1a680869bbbb3b188850.