
Figures & data
Table 1. The number and orbit of several mega constellations
Figure 1. The encounter plane of two objects(Zaidi and Hejduk Citation2016).
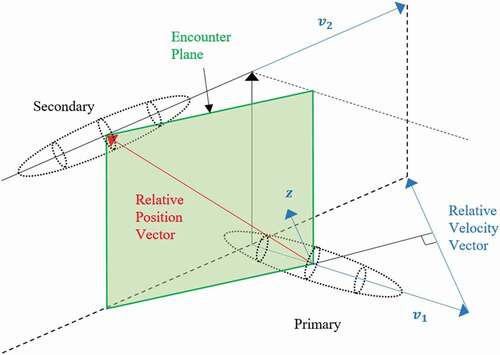
Figure 2. The CA and collision probability distributions of the current space in the May 2019 week.
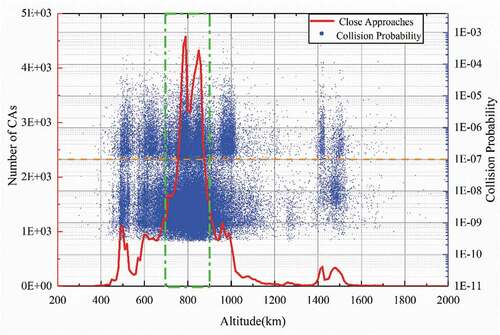
Table 2. Grouping CAs in the 800 km – 900 km altitude region in terms of RSO size
Figure 3. Collision probability map before (left) and after (right) adjusting only one of two RSO sizes in the original SS CAs from small to large.
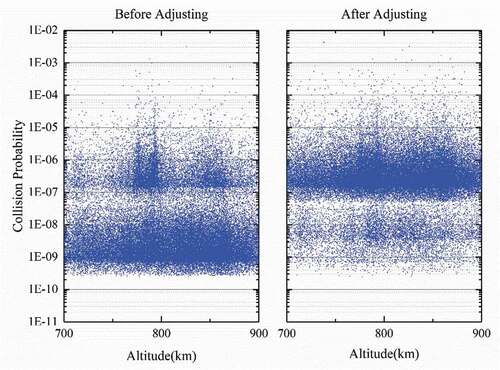
Figure 4. CAs in four weeks over a year.
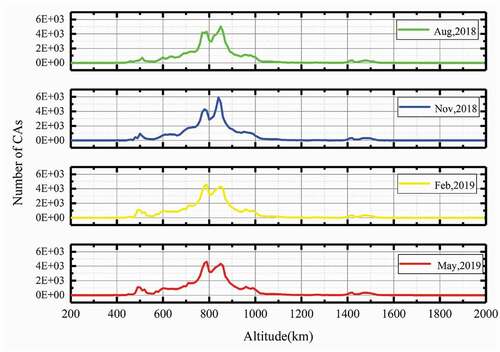
Table 3. Numbers of RSOs and CAs in the chosen representative 4 weeks
Figure 5. Distributions of CAs according to RSO type and size. The left one is the CA distribution with respect to the RSO type, and the right one to the RSO size. Sat stands for satellites, R/B for rocket body, and Deb for debris.
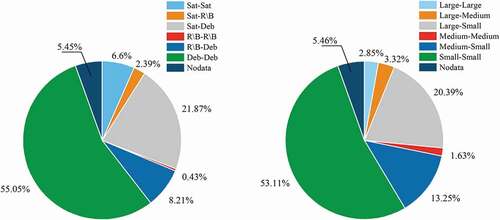
Table 4. Design of simulated constellations
Figure 6. RSO partitions of CAs with Starlink-like constellation in the May 2019 week.
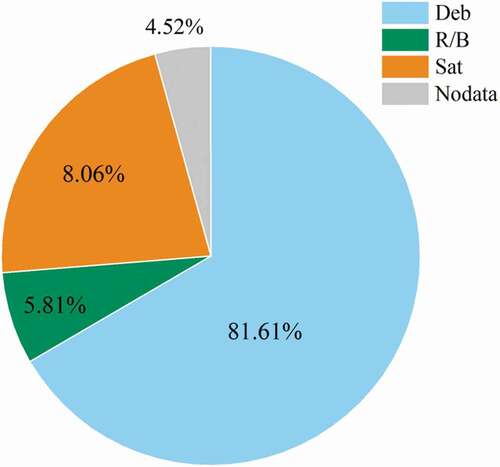
Figure 7. CAs and collision probability map in sub-constellation shells without and with the Starlink-like constellation.
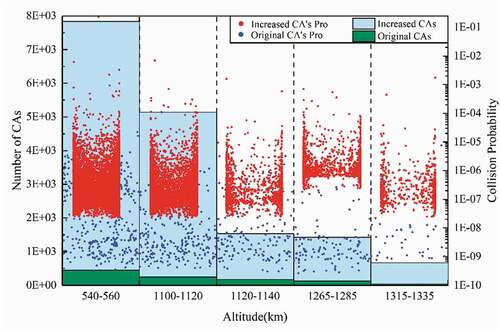
Table 5. Changes on the number of CAs at corresponding shells
Figure 8. Red and yellow warning increases due to the Starlink-like constellation.
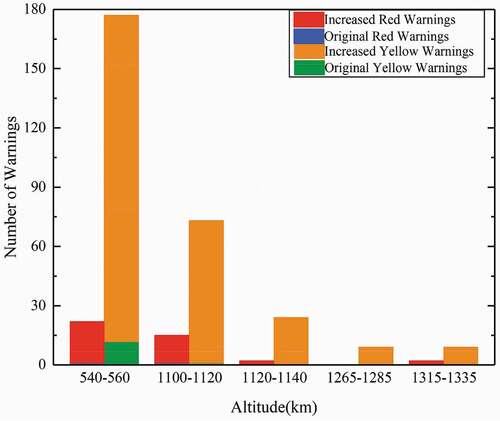
Table 6. The number of red and yellow warnings CAs due to the Starlink constellation
Table 7. The changes of overall collision probability in the May week due to the Starlink-like constellation
Figure 9. Partition of the CAs involving Starlink-like satellites in terms of RSO type.
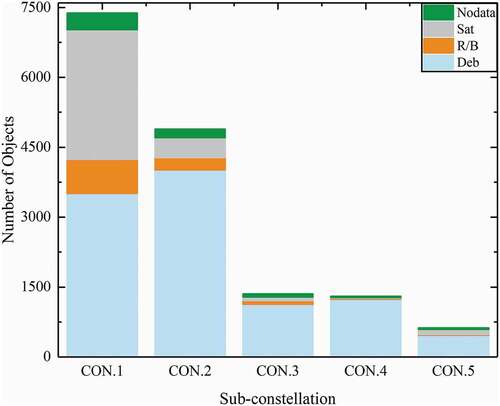
Table 8. Orbital information and effects of two Chinese constellations
Table 9. Orbits of hypothetical constellations
Figure 10. Effects of three hypothetical LEO constellations and CON.2 on corresponding regions.
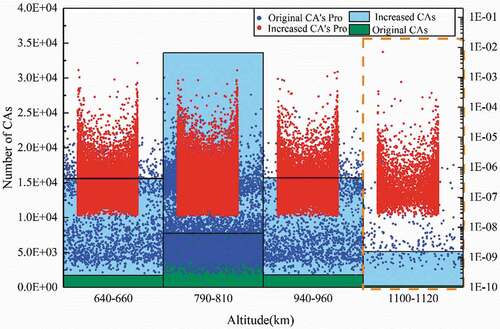
Table 10. Changes on numbers of CA at corresponding shells
Figure 11. Red and yellow warning increases due to the hypothetical constellations.
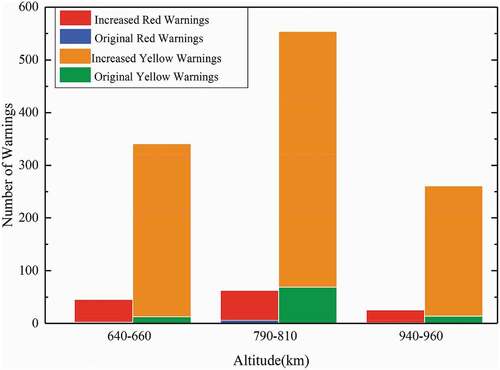
Table 11. The overall collision probability changes due to the hypothetical constellations
Figure 12. Increased warnings involving RSO satellites. The upper one is the increased red warnings and the lower one on the yellow warnings. The bar charts in the green box are for warnings due to the three hypothetical constellations, and the rest of the charts to the Starlink-like sub-constellations.
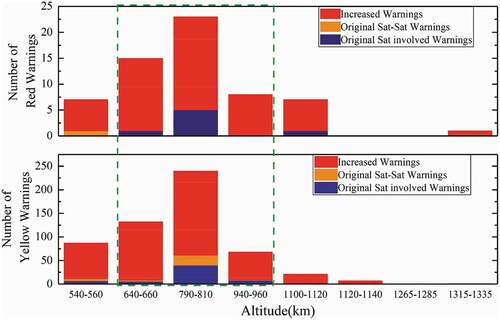
Table 12. The increased warnings involving RSO satellites
Table 13. The comparison of the effect of ICON.2 and ICON.4 on RSOs
Figure 13. Latitudinal distribution of CA numbers within 790–810 km.
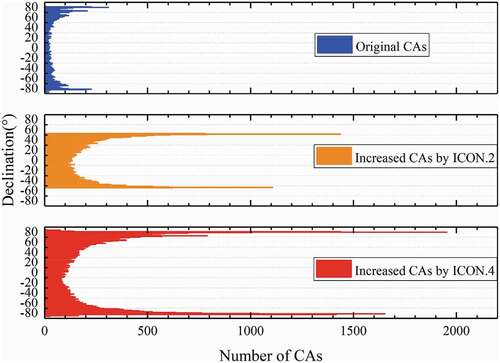
Table 14. The CAs and overall collision probability between E-Hongyan and CON.2 over a week