
Figures & data
Figure 1. Study area.
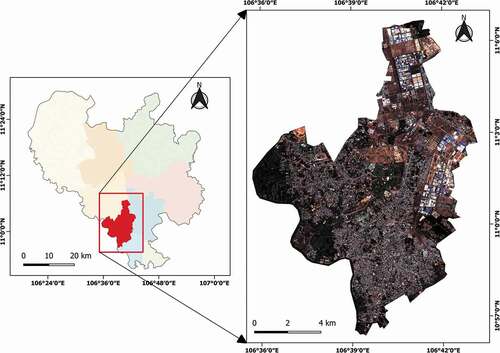
Figure 2. Land cover classes in the study area.
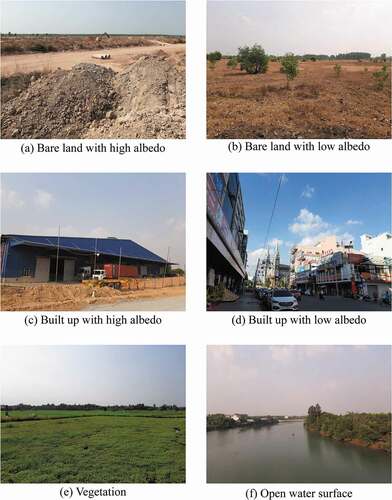
Figure 3. Process flowchart.
Table 1. Summary of the input datasets.
Table 2. Comparison of the overall accuracy and Kappa coefficient of the classification result of all datasets.
Figure 4. Land cover maps from the datasets without textures and indices: (a) dataset D1; (b) dataset D2; (c) dataset D5; (d) dataset D7 using PA.
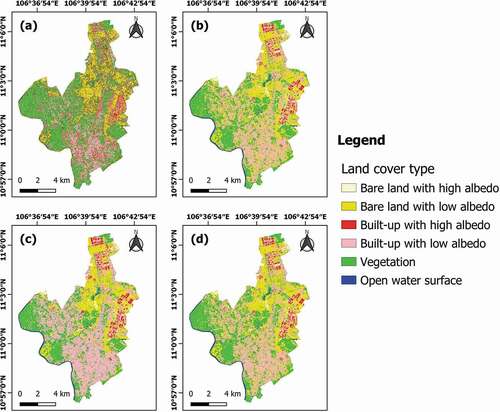
Figure 5. Land cover maps from the datasets with textures and indices: (a) dataset D3; (b) dataset D4; (c) dataset D6; (d) dataset D8 using PA.
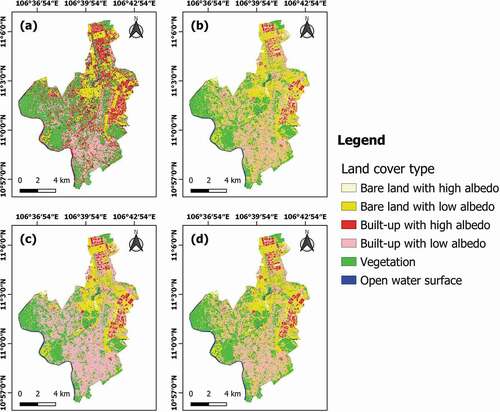
Table 3. The producer’s accuracy and user’s accuracy of the classification result of the datasets without textures and indices.
Table 4. The producer’s accuracy and user’s accuracy of the classification result of the datasets with textures and indices.
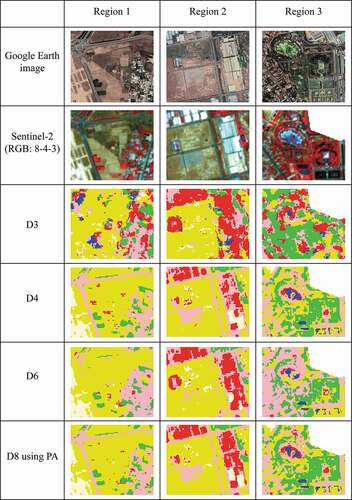
Figure 6. Comparison of the classification results from the datasets with textures and indices in three example regions.
Data availability statement
The satellite images can be downloaded from the Copernicus Scientific Data Hub (https://scihub.copernicus.eu/). The administrative boundary can be downloaded from the Database of Global Administrative Areas project website (https://gadm.org/). The ground truth data and R code are available from the corresponding author, [Dang Hung Bui], upon reasonable request.