
Figures & data
Figure 1. Geographic location of the study area: City of Toronto.
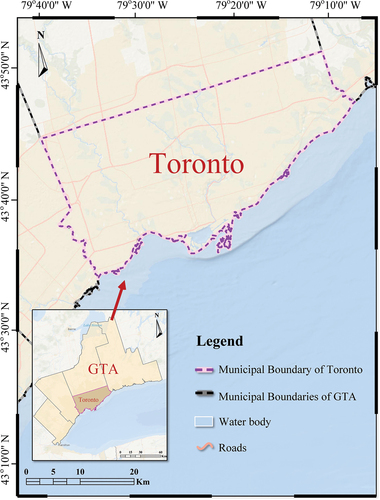
Table 1. Reclassification and generalization of land use categories.
Figure 2. Spatial patterns of auxiliary geospatial variables. All variables were normalized into the range of 0–1.
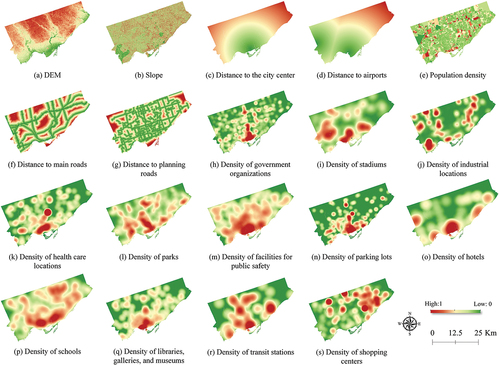
Table 2. List of auxiliary geospatial variables used in the study.
Figure 3. The methodology of the proposed A-VCA model.
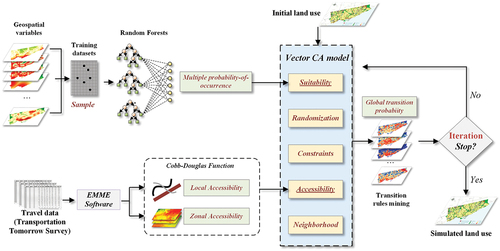
Table 3. The calibrated parameters of local accessibility in this study.
Table 4. Calibrated parameters for zonal accessibility, Cobb–Douglas function, RFA formulation, and neighborhood interaction in the A-VCA model.
Figure 4. The normalized zonal accessibility for the nine land use subtypes in the study area.
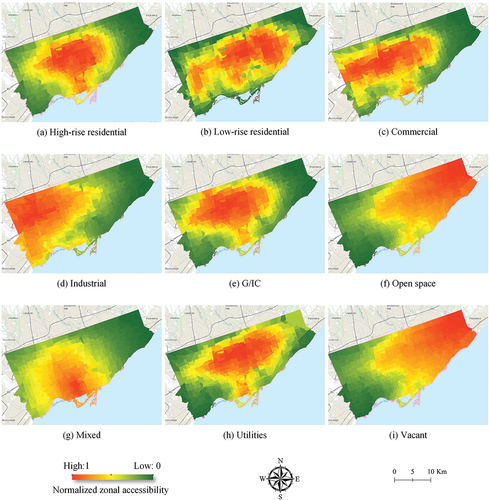
Figure 5. The normalized local accessibility in the study area.
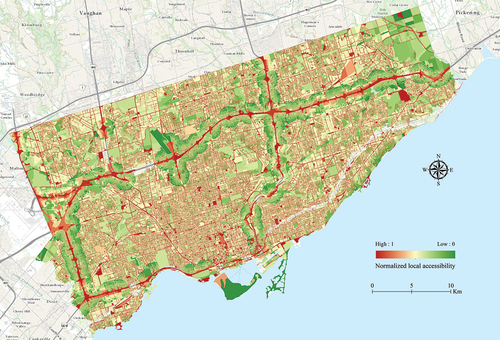
Figure 6. Spatial patterns of land use suitability for the nine urban land use subtypes.
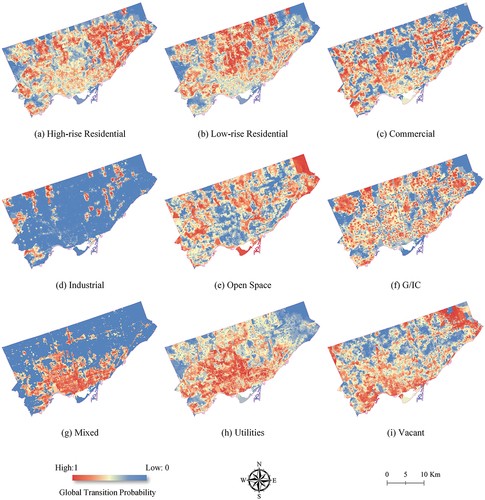
Figure 7. The simulated and actual land use patterns in this study.
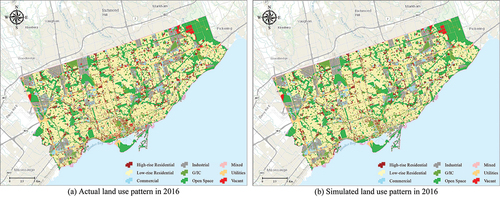
Figure 8. Enlargement of simulated and actual land use patterns in downtown Toronto.
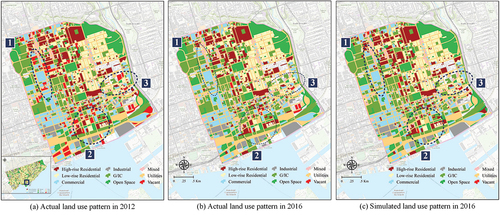
Table 5. The actual and simulated proportions of land use changes in the City of Toronto and downtown Toronto.
Table 6. Accuracy assessment and model comparisons for urban land use simulation.
Table 7. Sensitivity of land parcel size to the model performance.