
Figures & data
Figure 1. The flow chart of the process of radiometric responsivity degradation. Chla: chlorophyll-a concentration, : diffuse attenuation coefficient at 490 nm,
: remote sensing reflectance at 555 nm,
: aerosol optical thickness at 869 nm, α: aerosol type.
Figure 2. The CV values of surface and atmospheric optical properties and stability in the SCS. The area delineated in the red rectangular box was selected as the stable ocean target in this study.
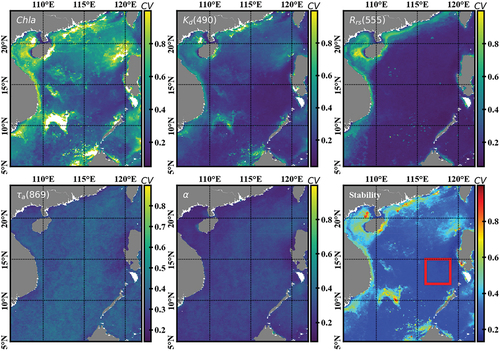
Figure 3. Time-series of monthly values of water and atmospheric optical properties in the region of 12 ~ 15°N and 116°~119°E in the SCS.
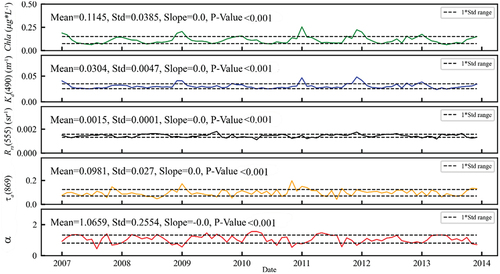
Figure 4. Time-series of TOA reflectance over SCS.
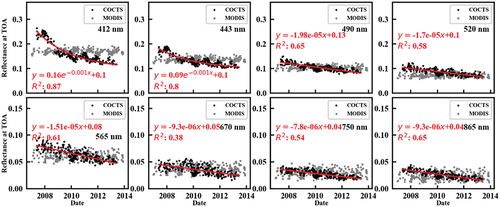
Figure 5. The annual mean degradation rates for each band of HY-1B COCTS.
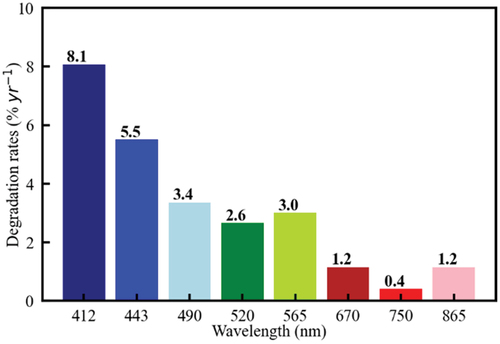
Figure 6. The improvement between degradation-corrected HY-1B COCTS and Terra MODIS data.
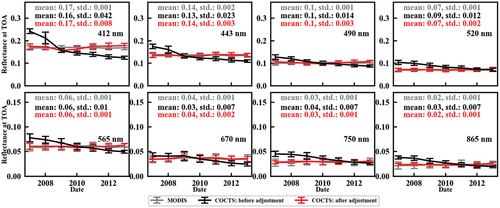
Figure 7. Maps of TOA reflectance on April 7 of 2013 before and after degradation adjustment of HY-1B COCTS and Terra MODIS.
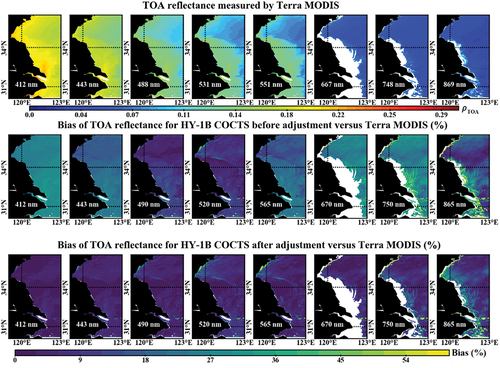
Figure 8. Maps of average bias of TOA reflectance before and after radiometric adjustment of HY-1B COCTS versus Terra MODIS.
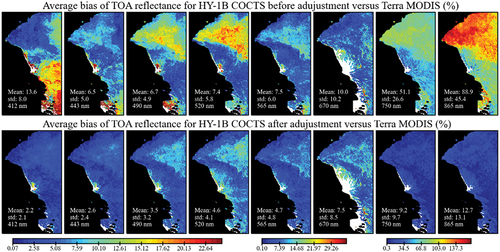
Table 1. Statistics of reflectance at TOA and bias between before and after degradation-corrected referenced Terra MODIS.
Data availability statement
The HY-1B COCTS data are available on application from the National Satellite Ocean Application Service (http://www.nsoas.org.cn/). The MODIS L1B data can be obtained from the Level-1 and Atmosphere Archive and Distribution System (https://ladsweb.modaps. eosdis.nasa.gov/). The MODIS level-3 data can be obtained from Ocean Color Level 3 browser (https://oceancolor.gsfc.nasa.gov/l3/).