
Figures & data
Figure 1. Tencent Population Density and estimated population density in 2015. (a) is the Tencent positioning points at 12 A.M. on 1 December 2019. (b) shows an estimated population density distribution in 2015. (c) shows the 32-levels’ classified results of the Average Tencent Population Density (ATPD) during the study period. (d) are the 32-levels’ classified density distribution corresponding to (b).
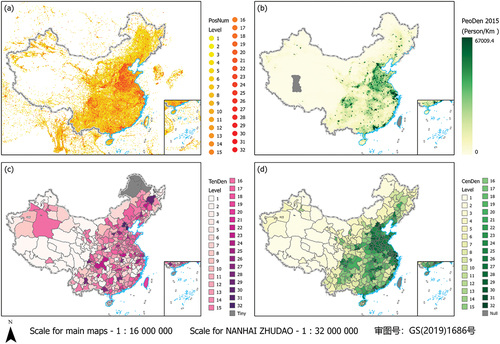
Table 1. Variable definition, source, and statistic description
Figure 2. Simple linear regression between ATPD and EPD.
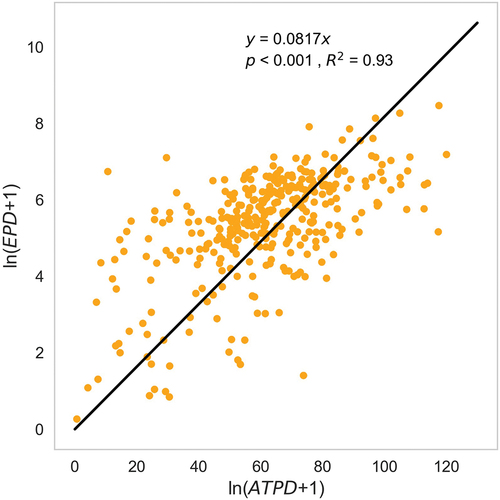
Table 2. Monthly global Moran’s I for dependent variables
Table 3. SDM pre-robustness test and effect selection
Figure 3. Main coefficients of NPD. (* p < 0.05, ** p < 0.01, *** p < 0.001).
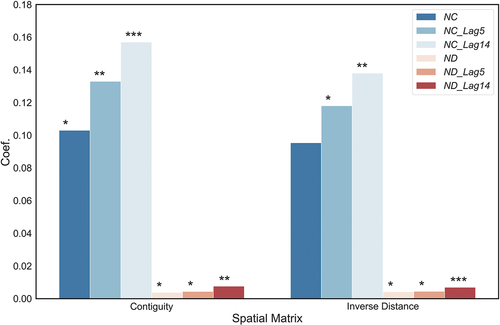
Table 4. Direct and indirect effects of variables on COVID-19 transmission
Figure 4. The relationship between EDPD and COVID-19.
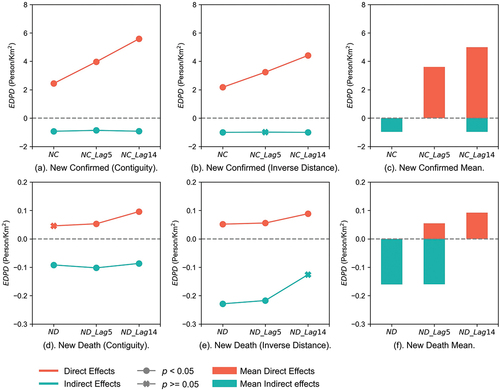
Table 5. and
of VS1.
Table 6. SDE model results of VS2
Supplemental Material
Download MS Word (283.1 KB)Data Availability Statement
The authors confirm that the data and the code supporting the findings of this study are available within the article and its supplementary materials.