
Figures & data
Table 1. Full situations of the quality monitoring.
Figure 1. Flow chart of the proposed quality monitoring procedure using a monitoring station network.
Figure 2. Monitoring station network with 70 globally distributed real-time stations.
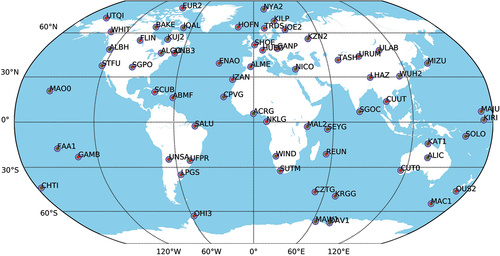
Table 2. Data and processing parameters used in the experimental evaluation.
Figure 3. Statistical analysis of the impacts of different user range errors caused by product biases on the positioning results in the horizontal (left) and vertical directions (right).
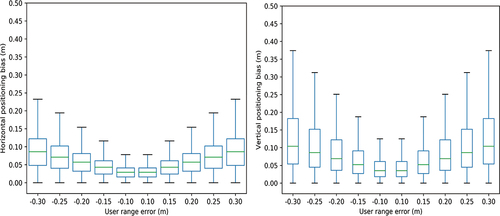
Figure 4. An example of (top) and
(bottom) for G15, the red triangles represent the positive and negative quality indicators. The dots represent the
in the top plot and
in the bottom plot, different colors represent different stations.
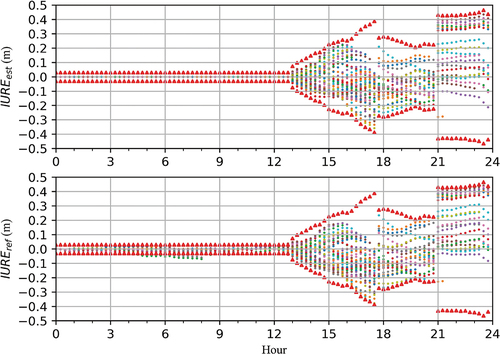
Figure 5. Bivariate histogram showing the absolute compared to the corresponding quality indicators for GPS satellites from DOY 204 to 225, 2021.
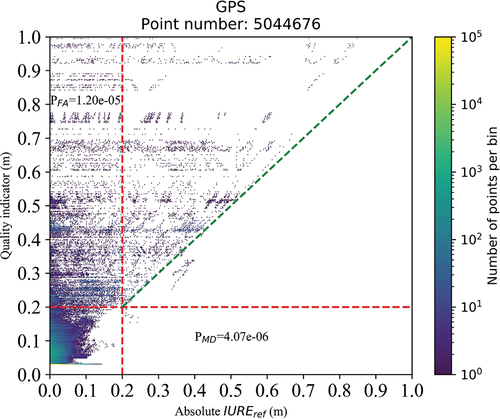
Figure 6. Histogram of the distribution of time to alarm (TTA).
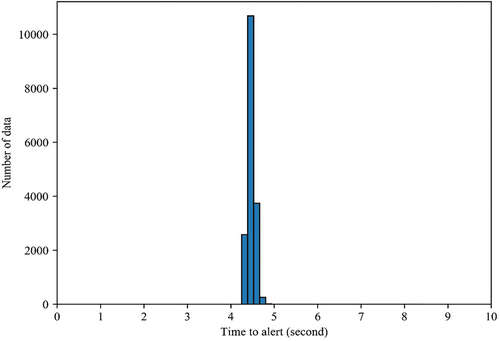
Figure 7. Difference between the real-time satellite product and GBM final product on DOY 221, 2021, in the radial (top-left), along (top-right) and cross (bottom-left) directions, and that of clock offset (bottom-right) after eliminating orbit radial differences. Satellite G10 and G32 have large differences, whereas the others with good agreement are selected for comparison.
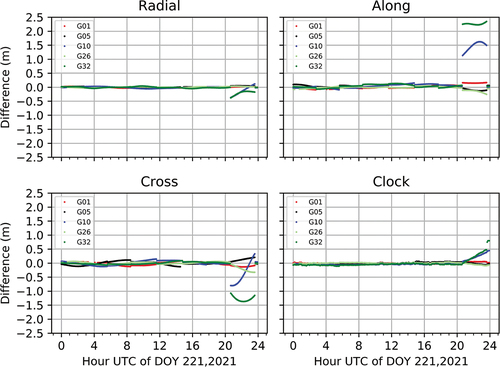
Figure 8. Estimated satellite product errors of G10 (left) and G32 (right). The red dots represent that an alarm is issued.
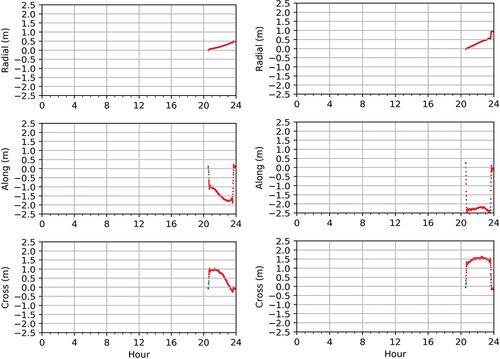
Figure 9. and
values for G10 (left) and G32 (right), the red triangles represent the positive and negative quality indicators. The dots represent the
in the top plot and
in the bottom plot, different colors represent different stations.
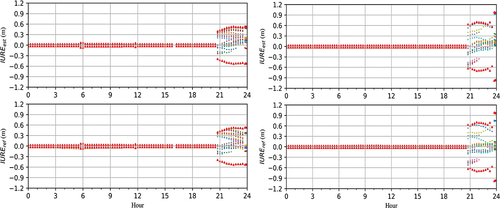
Figure 10. Raw kinematic PPP results using GPS observations and GFZ real-time satellite products for station OUS2 (left) and WHIT (right) on DOY 221, 2021.
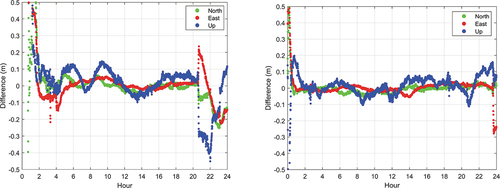
Figure 11. Kinematic PPP results using GPS observations and GFZ real-time satellite products for station OUS2 (left) and WHIT (right) with and without the quality monitoring on DOY 221, 2021. Black points are the raw results and red points are the results excluding the detected problematic satellites.
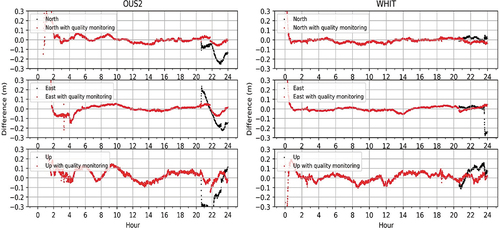
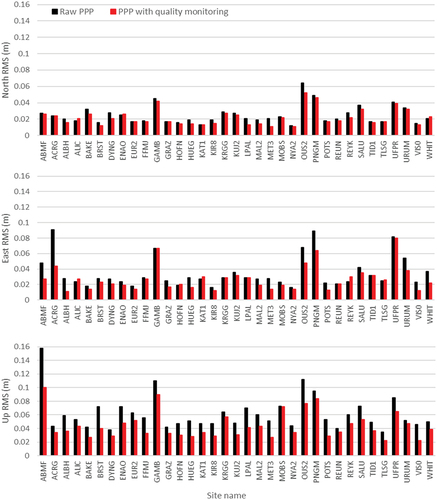
Figure 12. RMS of the difference between kinematic PPP results and the reference coordinates in the north (N), east (E) and up (U) directions for the entire day at 35 stations.
Data availability statement
The real-time satellite orbit and clock products used in this study are available from caster: products.igs-ip.net:2101 with mountpoint SSRA00GFZ0.