Figures & data
Figure 1. Illustration of DYB (Sun-fixed) and XYZ (body-fixed) orthogonal frames (Rodriguez-Solano, Hugentobler, and Steigenberger Citation2012).
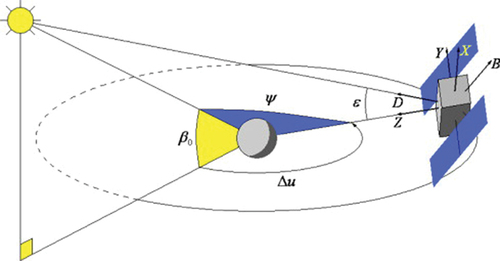
Table 1. Values of parameters in the a priori SRP model for BDS GEO satellites (Wang et al. Citation2019; units: nm/s2; angle in degrees).
Figure 2. Distributions of MGEX (blue) and iGMAS (red) stations used in ultra-rapid orbit prediction experiment.
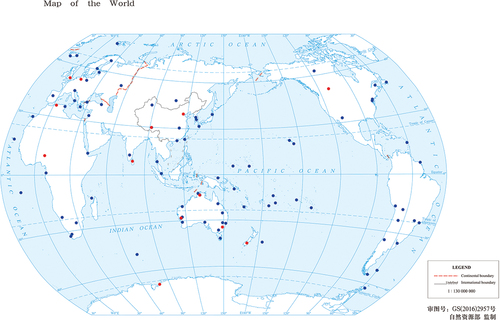
Table 2. Orbit dynamic models.
Figure 3. Correlations between empirical along-track acceleration and SRP parameters with 24-h, 48-h, and 72-h orbit arc lengths. Other BDS GEO satellites show similar performances.
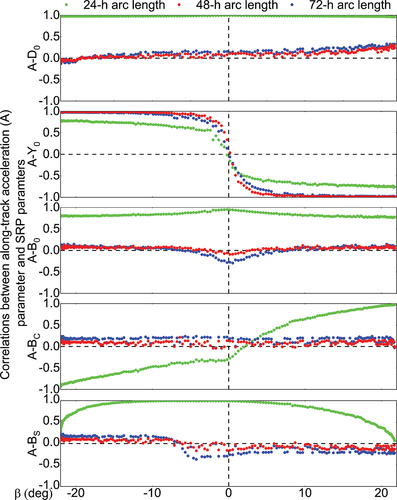
Figure 4. Workflow of orbit prediction and comparison.
Figure 5. Daily OBDs time series of observed orbits for strategies 1, 2, and 3 in the radial (R), cross-track (C), and along-track (A) directions for BDS C01 satellite (unit: m). The gray blocks indicate the satellite eclipse seasons. The black lines indicate the elevation angle of the Sun above the satellite orbital plane. Other BDS GEO satellites showed similar performance.
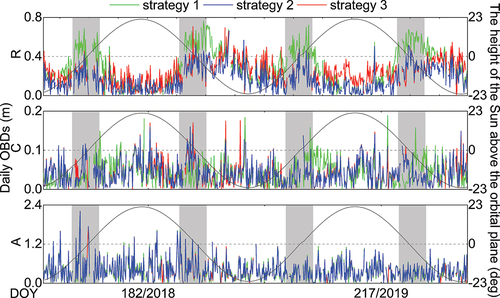
Table 3. The daily OBDs RMS values of BDS GEO satellites.
Figure 6. SLR residual time series of observed orbits for strategies 1–3 for BDS C01 satellite (unit: m).
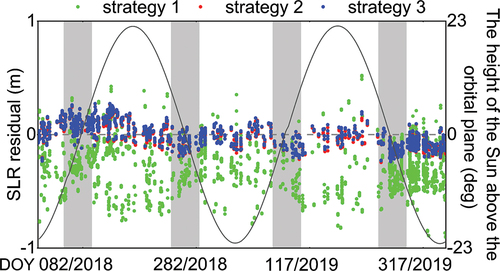
Table 4. Mean and STD of SLR residuals for observed orbits for BDS C01 satellite (unit: m), as determined by strategies 1–3.
Figure 7. Daily RMS of BDS C01 orbit overlap differences in the radial, cross-track, and along-track directions for the fitting arc lengths of 24-h, 48-h, and 72-h with different strategies. Other BDS GEO satellites show similar performances.
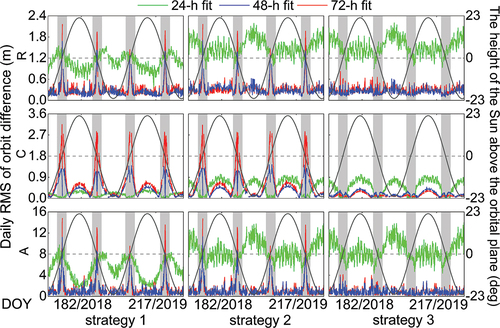
Figure 8. Correlations between SRP parameters and the PX, PY, PZ (satellite position parameter in the X, Y and Z direction of the celestial reference frame) parameters, VX, VY VZ (satellite velocity parameter in the X, Y and Z direction of the celestial reference frame) parameters of 48-h orbit arc length for BDS C01 satellite when β is equal to 21 degrees, parameter correlations of 24-h and 72-h orbit arc length show similar characteristics.
Table 5. Average RMS values of all BDS GEO satellites in the three directions and the 3D component for strategies 1–3 with fitting arc lengths of 24-h, 48-h, and 72-h for eclipse (E) and non-eclipse (NE) seasons (unit: m).
Figure 9. Time series of SLR residuals for predicted orbits with 24-h, 48-h, and 72-h fitting arc lengths of BDS C01 satellites (unit: m). Other BDS GEO satellites show similar performances.
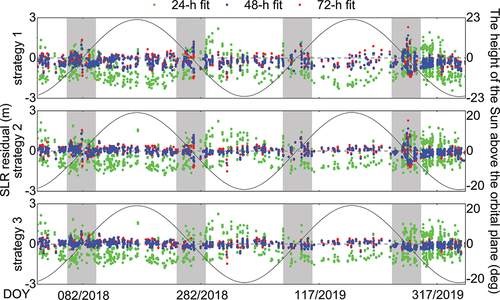
Table 6. Means and STDs of SLR residuals of orbit prediction for the three strategies (unit: m).
Figure 10. Estimated SRP parameters (D0,Y0,B0,BC, and BS) time series with fitting arc lengths of 24-h, 48-h, and 72-h for strategies 1–3 for BDS C01. Other BDS GEO satellites show similar performances.
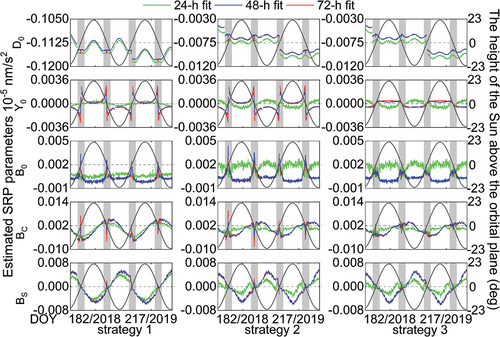
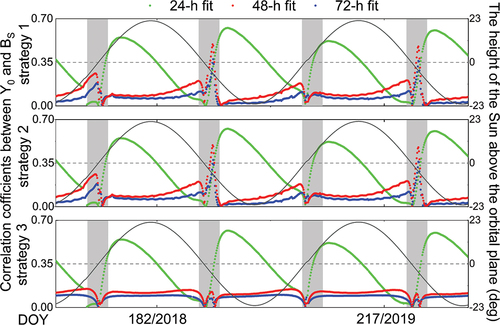
Figure 11. Correlations coefficients between the Y0 and BS parameters of BDS C01. The black lines indicate the elevation angle of the Sun.