
Figures & data
Figure 1. Overall architecture of CasREL.
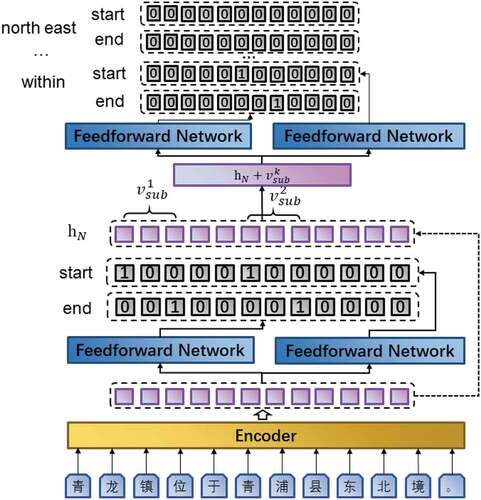
Figure 2. Overall architecture of PURE.
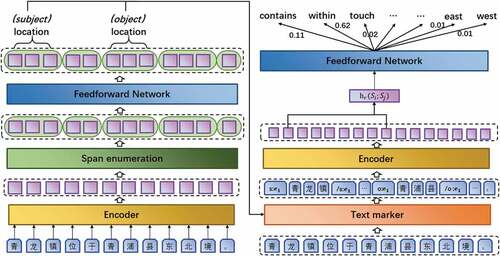
Figure 3. Dataset is divided, and the original data set is manually labeled and divided into fine-tune and eval datasets, where the fine-tune data set is divided into training sets, validation sets, and test sets according to the Bootstrapping method.
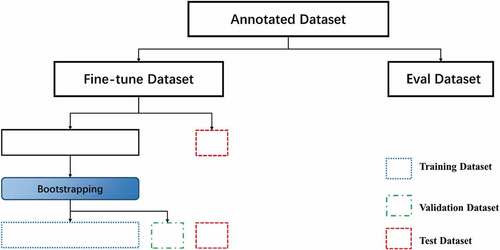
Table 1. Location contains a comparison table of geographic entity types and samples.
Table 2. Spatial entity contains a comparison table of geographic entities with samples.
Table 3. Example of annotated records and their corresponding English translations.
Figure 4. Training losses (a) and F1 scores (b) at different max sequence length of CaREL on validation dataset.
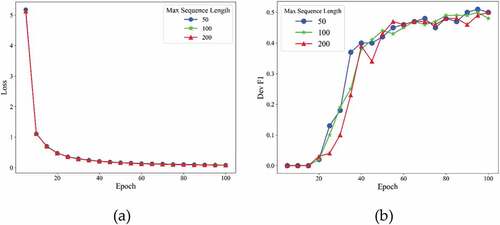
Figure 5. Training losses (a) and F1 scores (b) at different learning rate of CaREL on validation dataset.
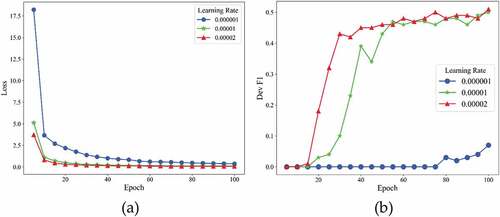
Figure 6. Training losses (a) and F1 scores (b) at different batch size of CaREL on validation dataset.
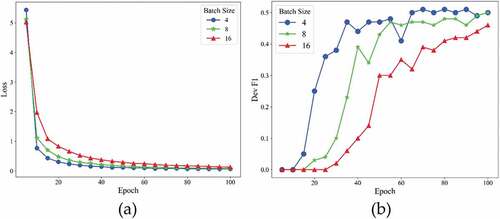
Table 4. Best predictive results of the CasREL and time cost under different hyperparameter settings.
Table 5. Best predictive results of the PURE entity model and time cost under different hyperparameter settings.
Figure 7. Training losses (a) and F1 scores (b)at different max sequence length of PURE on validation dataset.
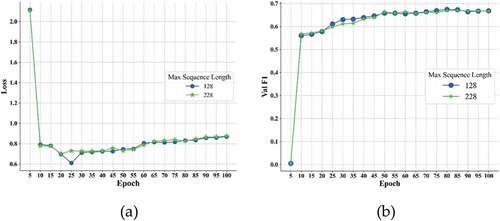
Figure 8. Training losses (a) and F1 scores (b) at different batch size of PURE on dev dataset.
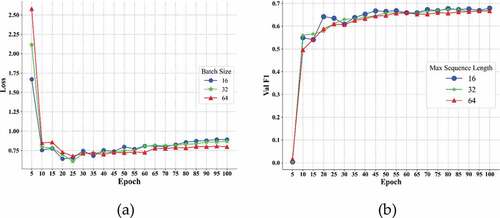
Figure 9. Training losses (a) and F1 scores (b) at different learning rate of PURE on validation dataset.
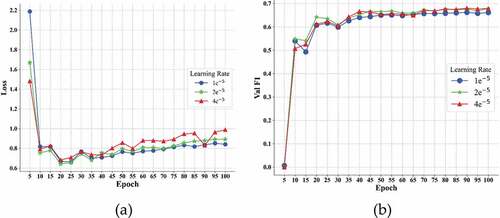
Table 6. Best predictive results of the PURE relation model and time cost under different hyperparameter settings.
Table 7. Comparative evaluation of jointly extraction and pipeline extraction methods.
Table 8. Comparison of extraction results of spatial relationship by manual interpretation.
Table 9. Comparative evaluation of spatial relations between joint and pipeline extraction by manual interpretation.
Table 10. The wrong extraction results of PURE.
Table 11. The wrong extraction results of CasREL.
Data availability statement
The data that support the findings of this study are available from the corresponding author upon reasonable request.