
Figures & data
Figure 1. Publication numbers per year of DLCD.
Table 1. The first proposed reference and DLCD reference for each DLNN.
Figure 2. The usage of spectral information in DLCD.
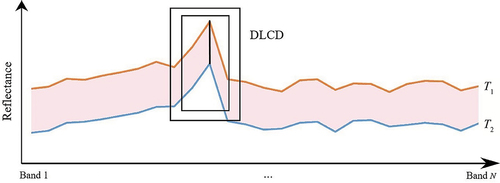
Figure 3. An example of the usage of spatial information in DLCD.
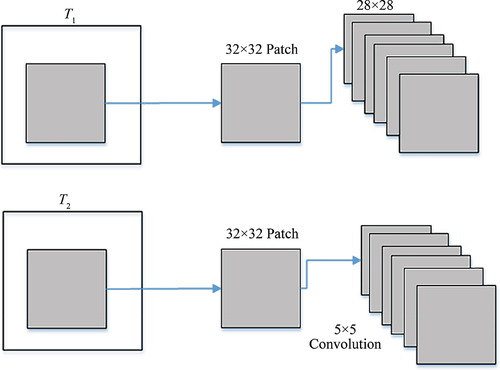
Figure 4. The usage of temporal information in DLCD.
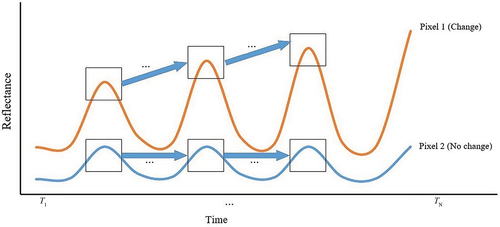
Figure 5. An example of the usage of multi-sensor information in DLCD.
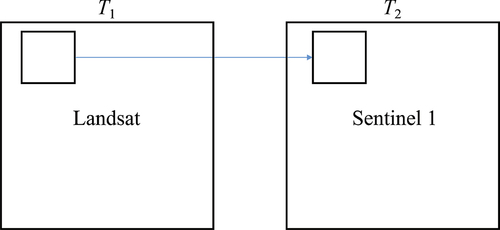
Figure 6. The structure of DLCD methods. Yellow boxes represent DLNNs while blue boxes denote the interaction of multi-date information. (a) Post-classification change method (PCCM). (b) Differencing method (DM). (c) Direct classification method (DCM). (d) Differencing neural network method (DNNM). (e) Mapping transformation method (MTM). (f) Recurrent method (RM). (g) Adversarial method (AM).
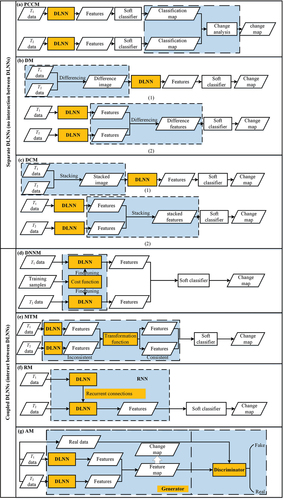
Table 2. The taxonomy, difference, definition, advantages, limitations, and applications of DLCD methods.
Figure 7. Distribution of overall accuracies for DLCD methods (differencing method (DM), direct classification method (DCM), differencing neural network method (DNNM), mapping transformation method (MTM), recurrent method (RM), and adversarial method (AM)).
Figure 8. Distribution of overall accuracies of binary changes for urban land use, water, hazard, and vegetation applications using the conventional change detection (CD) and DLCD methods.
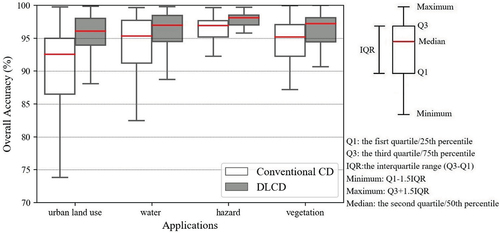
Figure 9. Distribution of overall accuracies of multi-class changes for urban land use, water, hazard, and vegetation applications using the conventional change detection (CD) and DLCD methods.
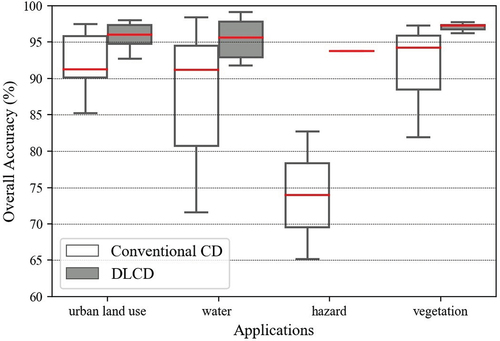
Figure 10. Distribution of overall accuracies of from-to changes for urban land use, water, hazard, and vegetation applications using the conventional change detection (CD) and DLCD methods.
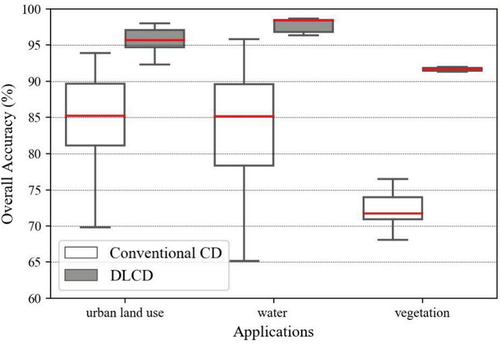
Table 3. The definition, advantages, limitations, and examples of solutions to the training sample dilemma in DLCD.
Figure 11. The relationship between DLCD, remote sensing, change detection, and deep learning.
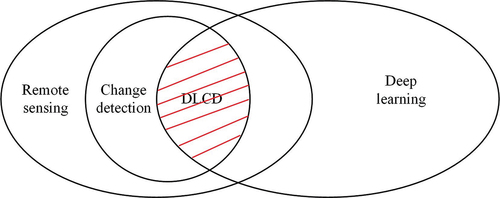
Table A1. Nomenclature.
Data availability statement (DAS)
The data that support the findings of this study are available from the corresponding author [L. Wang], upon reasonable request.