
Figures & data
Figure 1. Crime rate in Haringey compared to London in 2020.
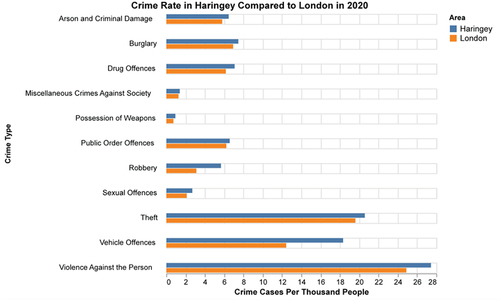
Figure 2. Haringey’s crime distribution and land use distribution.
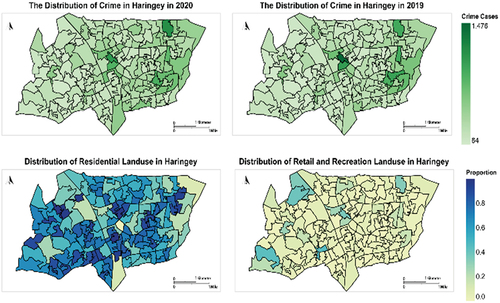
Table 1. Information of features.
Figure 3. Flowchart of the crime hot street map.
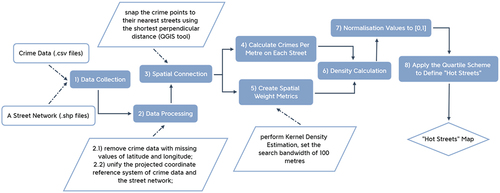
Table 2. Comparison of spatial regression models.
Figure 4. Number of crimes in Haringey from 2017.01 to 2020.12.
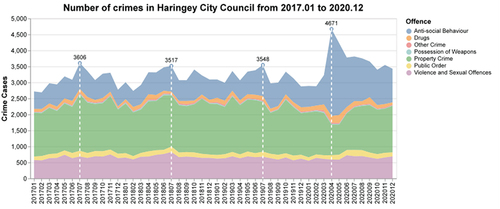
Figure 5. The results of global Moran’s I.
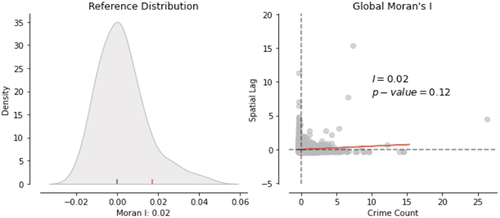
Figure 6. The results of local spatial autocorrelation.
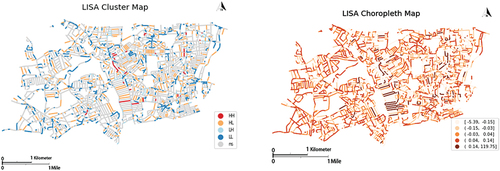
Figure 7. Three-Dimensional visualisation of crime density in Haringey (2020 compared to 2019, zoom in on the value at a scale of 1 mile).
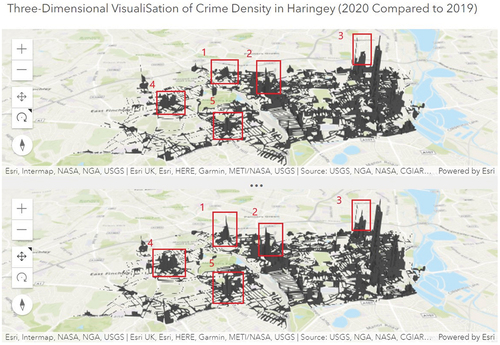
Figure 8. “Hot street” maps of different crimes in Haringey in 2020.
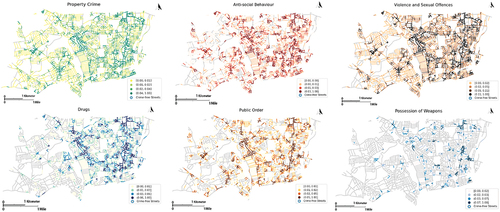
Figure 9. Crime change of different crimes in Haringey (2020 VS 2019).
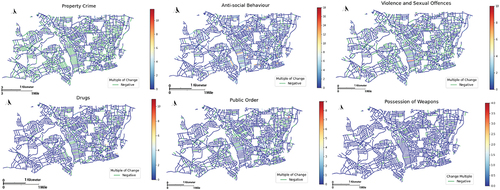
Table 3. Haringey’s number of street segments by different crime types.
Table 4. Comparison of the results of four regression models.
Table 5. Top 10 “Hot street” of crime in 2020.
Figure 10. Estimates of parameters and R-square of streets in Haringey estimates of parameters and R-square of streets in Haringey.
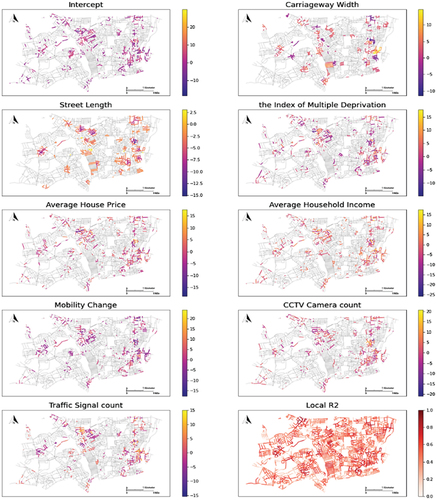
Figure 11. Haringey’s mobility change in April, August, and November 2020.
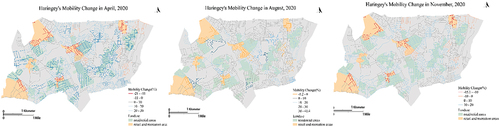
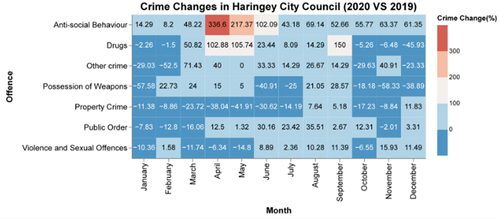
Figure 12. Crime changes in Haringey (2020 VS 2019).
Data Availability Statement
Data available on request from the authors. The data that support the findings of this study are available from the corresponding author, upon reasonable request.