
Figures & data
Figure 1. Proposed methodology for the automated extraction of individual Stone Pine trees.
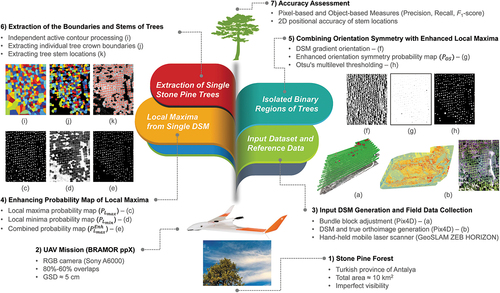
Figure 2. Overview of the study area.
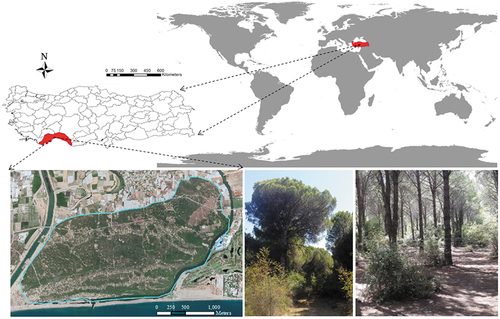
Figure 3. Orthomosaic of the study area, and sample images from the study area.
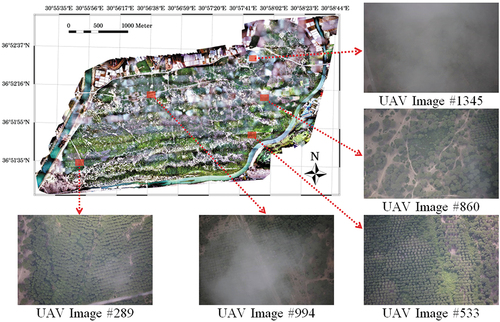
Figure 4. Test sites selected from the study area (The red polygon in each test site presents the coverage of the reference data collected during fieldwork; the blue triangles represent the positions of GNSS receivers deployed for HMLS measurements).
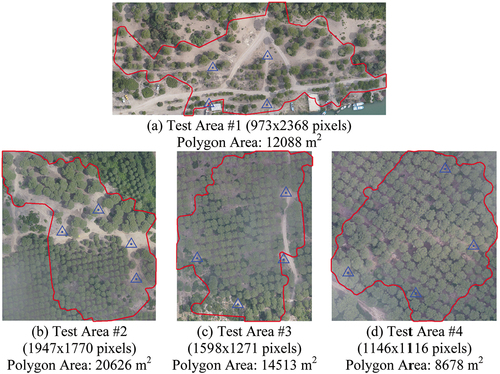
Figure 5. (a) DSM of test site #3. (b) Probability map of local maxima. (c) Probability map of local minima. (d) Enhanced probability map of local maxima. Notice how unnecessary local maxima information is suppressed in (d) compared to (b).
Figure 6. (a) DSM of test site #3; (b) Probability map of orientation symmetry combined with enhanced local maxima; (c) Output binary map.
Figure 7. (a) DSM of test site #3; (b) Automatically extracted regions; (c) Stems of individual trees.
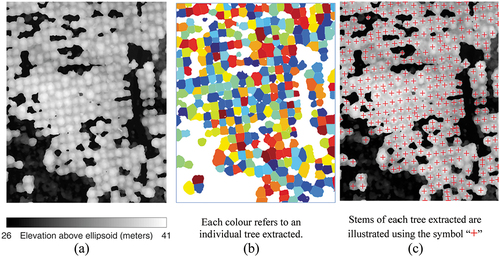
Figure 8. Georeferenced HMLS point clouds. (a) Test site #1; (b) Test site #2; (c) Test site #3; (d) Test site #4; (e) and (f) Sample 3D view of the HMLS point cloud and a detailed view of Stone Pine trees.
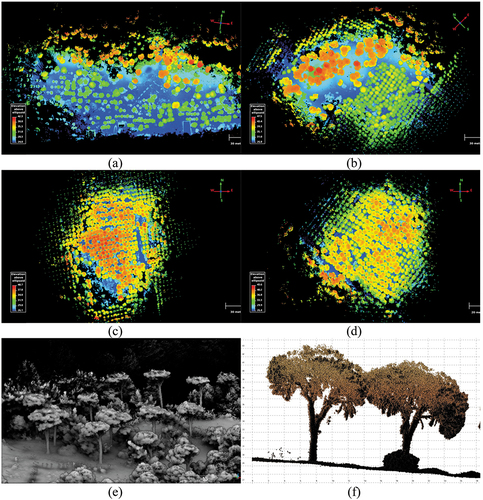
Figure 9. (a) a sample HMLS point cloud; (b) Detection of ground points; (c) segmented objects; (d) the output of cylinder fitting process; (e) and (f) Cylinder fitted to a single stem using least squares.
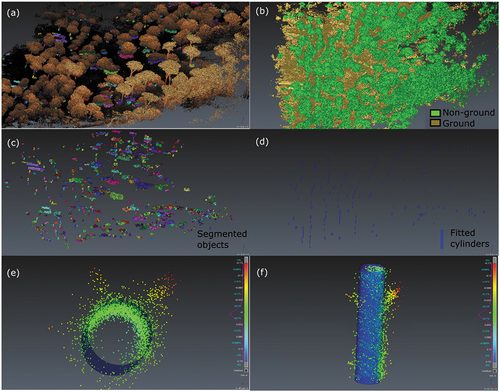
Table 1. Parameter settings of the proposed methodology (the operators and
rounds a floating number to the lowest preceding and the largest succeeding integer value, respectively).
Figure 10. Pixel-Based (left column) and object-based (right column) performances of the proposed methodology.
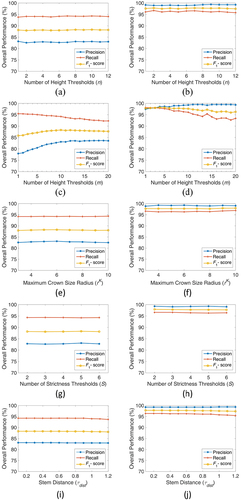
Table 2. The elapsed time of each section of the proposed methodology.
Figure 11. Visual outcomes of the proposed methodology (The results of the test sites #1-#4 are provided from top to bottom, respectively; the input DSM, the extracted regions for trees, and the visual output of the accuracy assessment are given from left to right, respectively).
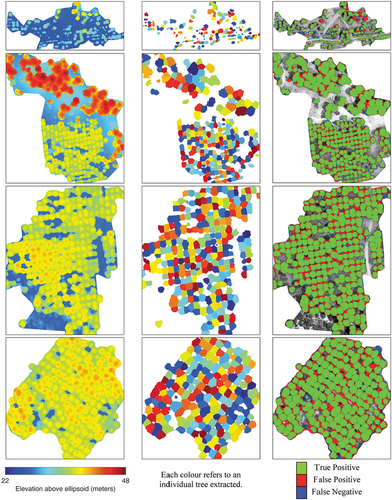
Table 3. Pixel- and object-based performance of the proposed methodology.
Figure 12. Graphical representation of the error vectors (note the scale of error vectors shown).
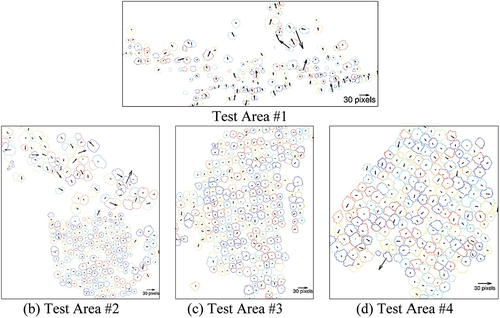
Table 4. 2D positional accuracy of automatically extracted stem locations.
Table 5. Pixel-Based comparison of the previous approaches and the proposed methodology (the best and second-best performances across approaches are illustrated in green and orange colors, respectively).
Table 6. Object-Based comparison of the previous approaches and the proposed methodology (the best and second-best performances across approaches are illustrated in green and orange colors, respectively).
Figure 13. Comparison with the previous studies (The results of the test sites #1-#4 are provided from top to bottom, respectively; the visual outputs of the approaches in Popescu and Wynne (Citation2004), Swetnam and Falk (Citation2014), Dalponte et al. (Citation2015b), and ours are given from left to right, respectively; green, red, and blue colors represent TP, FP, and FN pixels, respectively).
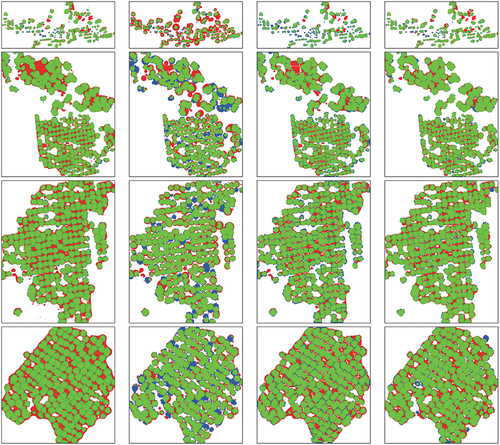
Table 7. Pixel-Based comparison of the previous approaches based on orientation symmetry and the proposed methodology (the best and second-best performances across approaches are illustrated in green and orange colors, respectively).
Table 8. Object-Based comparison of the previous approaches based on orientation symmetry and the proposed methodology (the best and second-best performances across approaches are illustrated in green and orange colors, respectively).
Data availability statement
The data that support the findings of this study are available from the corresponding author upon reasonable request.