Figures & data
Table 1. The data quality analyses applied to different LandSense pilots. The numbers in each cell indicate the number of checks carried out for that QA service and pilot. Gray cells indicate that that particular QA service was not applicable to the pilot study.
Figure 1. Examples of 4 photographic images acquired during the LandSense project and the calculated blur level. (a) paysages pilot, blur level 162, (b) paysages pilot, blur level 216, (c) natura pilot blur level 248 and (d) MijnPark.Nl pilot blur level 249. Note these all fail to meet the blur threshold used in LandSense but could still be useful to other studies.
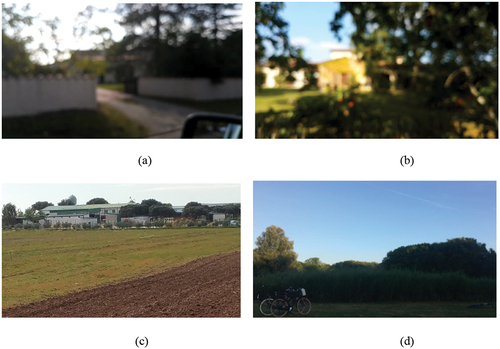
Table 2. Summary of the photograph blur and brightness check results for the pilot studies. Numbers indicate the actual number of photographs (and as a % of the relevant total).
Figure 2. Examples of images before (left) and after (right) correction. (a) paysages pilot, successful image sharpening to correct for blur and (b) paysages pilot unsuccessful correction for blur and brightness.
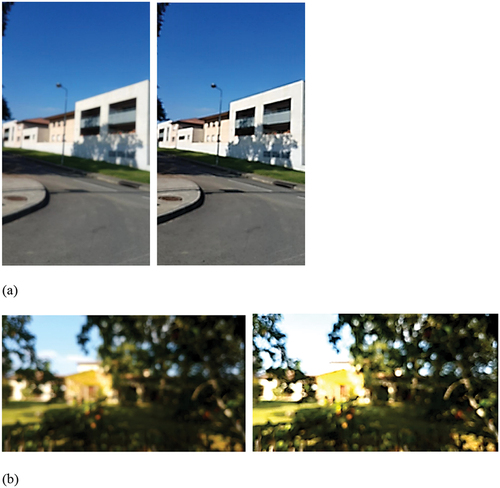
Figure 3. Examples of photographic images over a range of brightness levels below the threshold used in LandSense. Brightness level of images shown (from left to right) are 2,8,36,46,56,68,81 and 94.
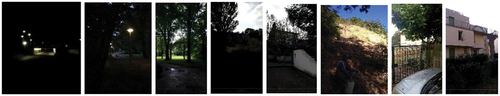
Figure 4. Examples of photographic images acquired that had high brightness levels. Brightness level of images shown (from left to right) are 110, 139, 151, 171, and 185.
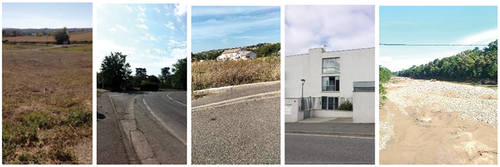
Figure 5. Accuracy results of face detection service for all pilots.
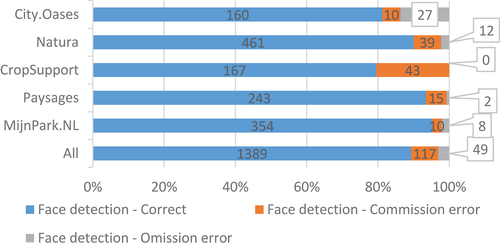
Figure 6. Examples of commission errors. (a) and (b) show commission errors for faces detected in crops, with red boxed areas supposedly containing a face, and (c) and (d) show a photograph before and after application of the licence plate detection software; note the metadata text in the bottom right of (c) is incorrectly masked out in (d).
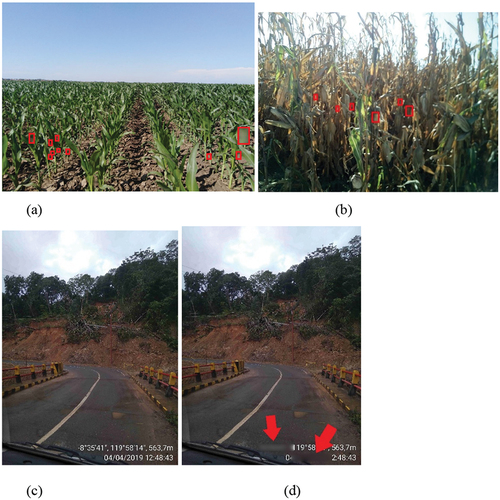
Figure 7. Accuracy results of license plate detection service for all pilots.
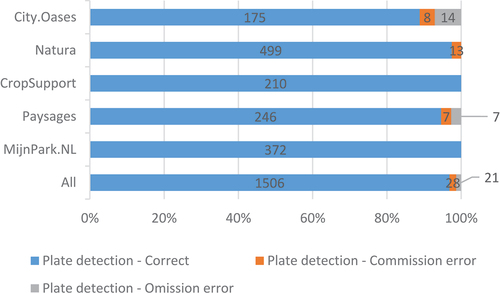
Figure 8. Examples of outputs from the licence plate detector. (a) output from PlateRecogniser LPDS which detected one more license plate (shown in blue) than the OpenALPR and (b) output from PlateRecogniser which shows detection of a licence plate that was identified by LandSense LPDS or the commercial version of OpenALPR. Note the presence of a commission error related to the construction signage on the right hand side of the image.
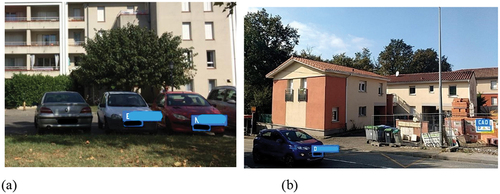
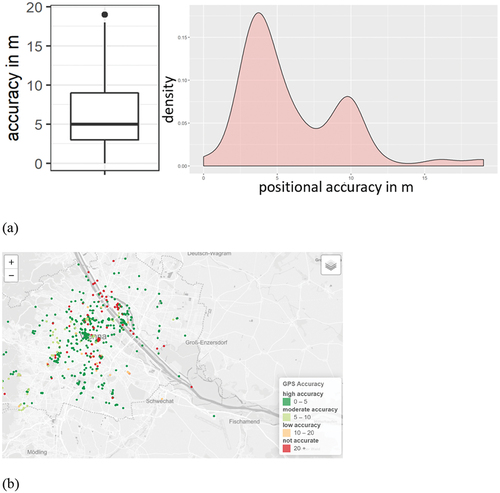
Figure 9. Example of positional errors for the city.Oases pilot. (a) statistical summary of the positional accuracy results and (b) a map showing the spatial distribution of errors of differing magnitude (base map provided by OpenStreetmap, © OpenStreetmap contributors).