
Figures & data
Figure 1. Four railway lines of Wuhan selected for this study.
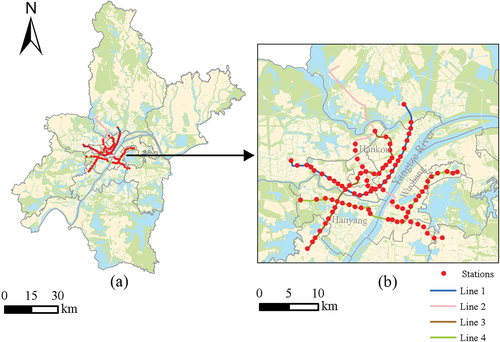
Figure 2. Framework of this study.
Figure 3. Diagram of the calculation of NLWLI around the rail transit station.
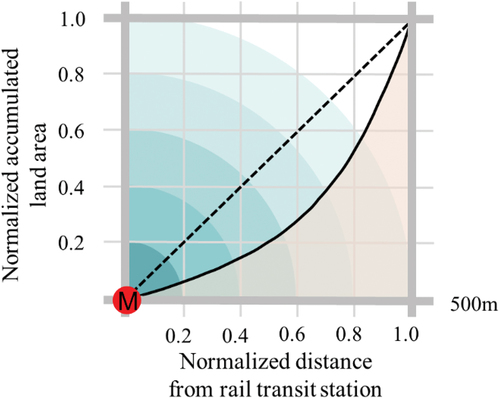
Figure 4. Typical high-frequency travel paths of passengers.
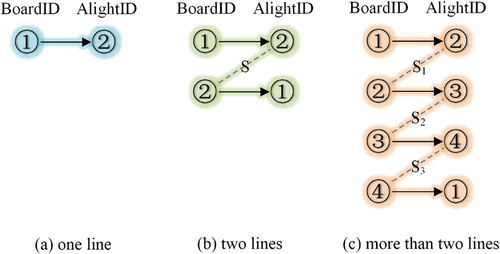
Table 1. Statistics for the land use indices.
Figure 5. Residents, jobs, and the value of JRNI around rail stations.
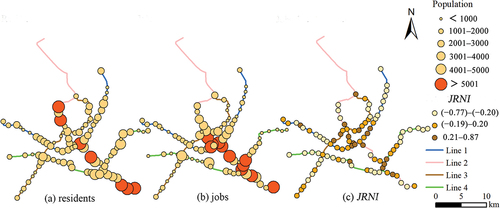
Table 2. Numbers of stations according to residents and jobs around the station.
Figure 6. Commuting flows from residential stations to working stations.
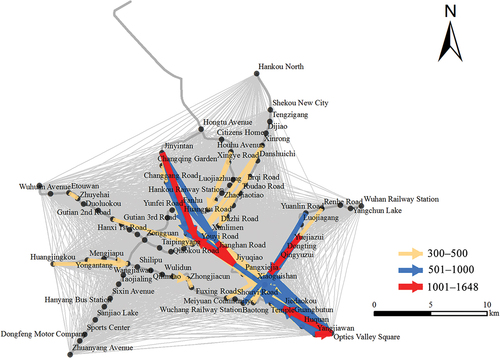
Table 3. Pearson correlation coefficients between residents, jobs, and land use indices at rail transit stations.
Figure 7. Residents, jobs and building density of four lines (station names are in Appendix A).
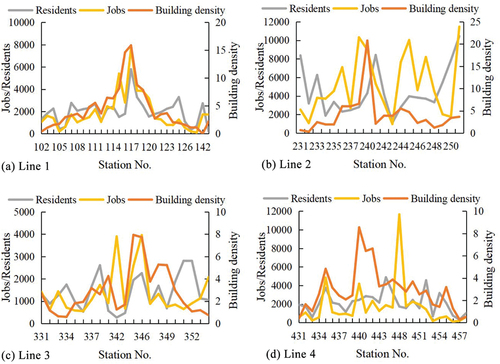
Table 4. Land use indices and JRNI of six vital stations.
Data availability statement
The data that support the findings of this study are available from the Wuhan Land Use and Urban Spatial Planning Research Center, https://doi.org/10.1080/10095020.2022.2100286 with permission or from the corresponding author [email protected] upon reasonable request.