
Figures & data
Figure 1. Verification sites and airborne flight area.
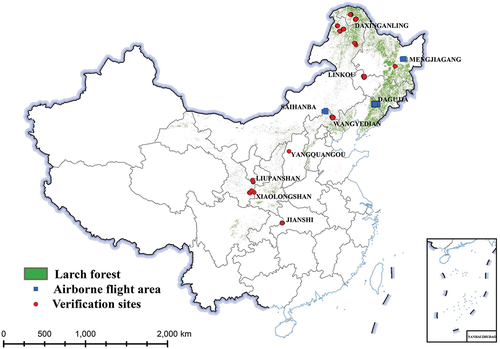
Table 1. Information of the field plot data.
Figure 2. Larch stock volume from ALS data.
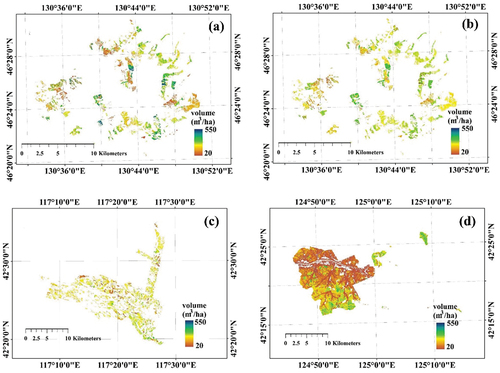
Figure 3. Flowchart of larch stock estimation from Sentinel-2 and LiDAR data.
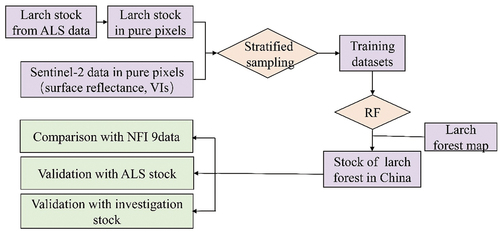
Figure 4. Accuracy of the larch stock estimation model.
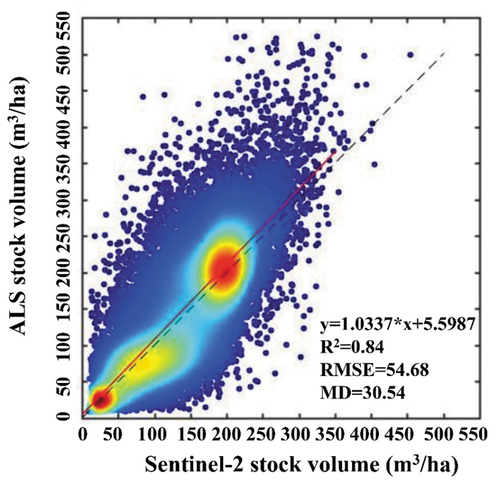
Figure 5. Larch stock map in China from Sentinel-2 data.
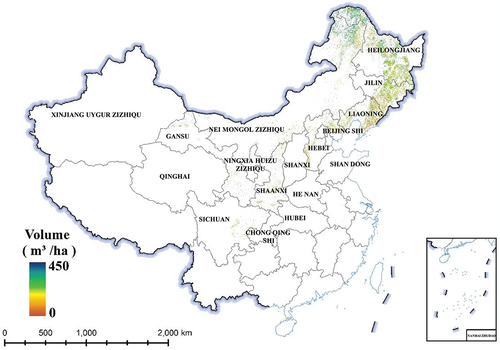
Figure 6. Comparison of the provincial volume per hectare.
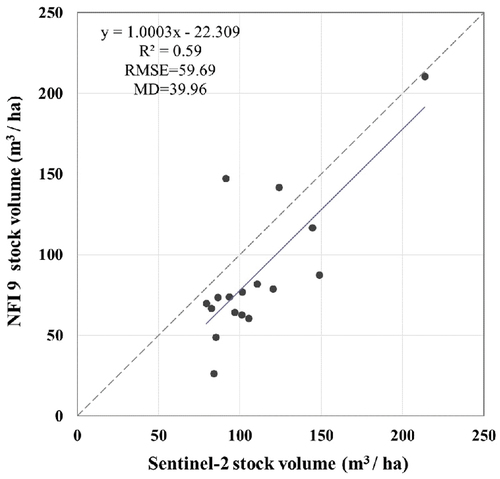
Figure 7. Validation with ALS larch stock. (a) Mengjiagang 2017; (b) Mengjiagang 2020; (c) Saihanba 2018; (d) Dagujia 2018.
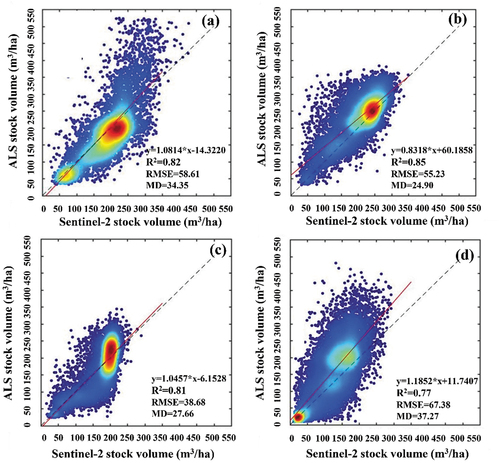
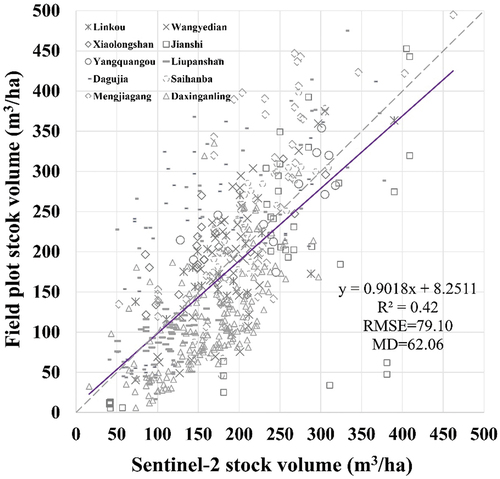
Figure 8. Validation with field investigated field plot stock volume data.
Data availability statement
Sentinel-2 data used in this paper are available at https://doi.org/10.1080/10095020.2022.2105754. The stock volume map of larch forest in China is available at https://doi.org/10.1080/10095020.2022.2105754.