
Figures & data
Figure 1. Schematic diagram of multipath tracking for TOA estimation with LTE signals in indoor environments.
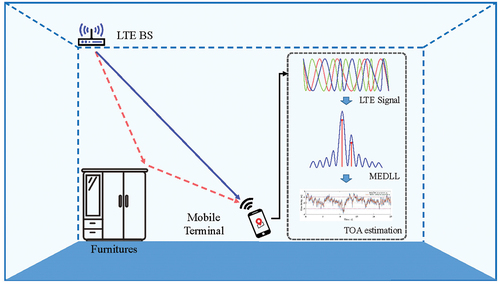
Figure 2. LTE frame structure and mapping of the pilots of CRS to resource elements.
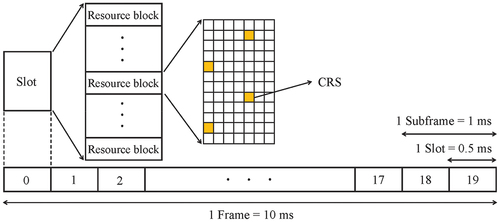
Figure 3. The location of the synchronization signal in the time-frequency grid of the 1.4 MHz bandwidth LTE signal.
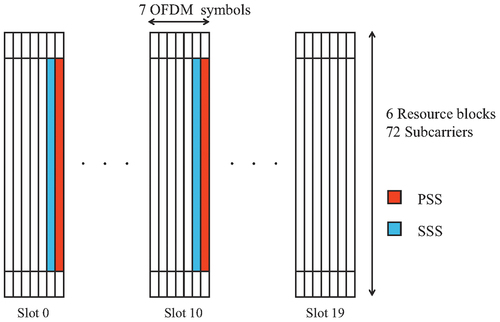
Figure 4. Block diagram of multipath tracking SDR for LTE signal carrier phase TOA estimation.
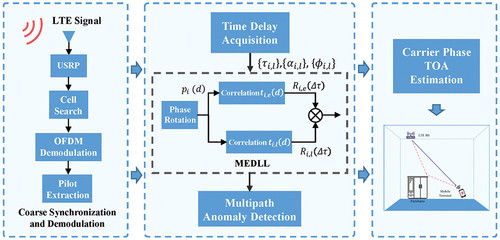
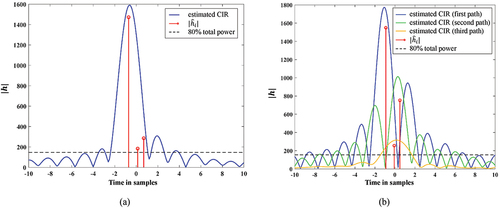
Figure 5. Comparison of the DLL algorithm and the MEDLL algorithm tracking process. (a) DLL. (b) MEDLL.
Algorithm. 1: The algorithm of the improved MEDLL.
Figure 6. Experimental scenario and test bench. (a) USRP based SDR test bench. (b) diagram of experimental scenario and landmark points.
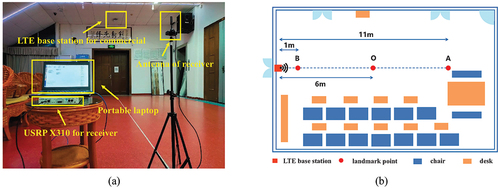
Table 1. Signal acquisition parameters.
Figure 7. The ACF of SSS, CRS, and GPS C/A.
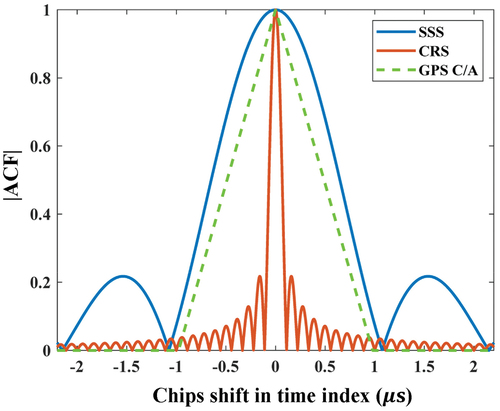
Figure 8. Comparison of different signal results based on the DLL algorithm and MEDLL algorithm in the static experiment. (a) time delay acquisition results for SSS. (b) test results based on SSS. (c) time delay acquisition results for CRS. (d) test results based on CRS.
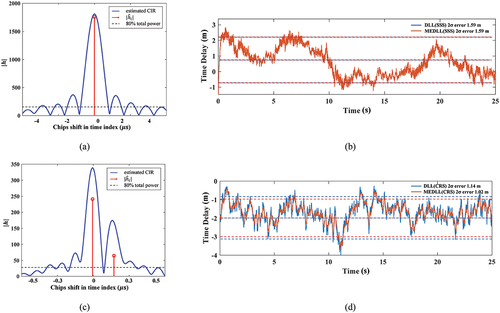
Figure 9. Comparison of statistical results under static conditions. (a) the CDF. (b) the boxplot.
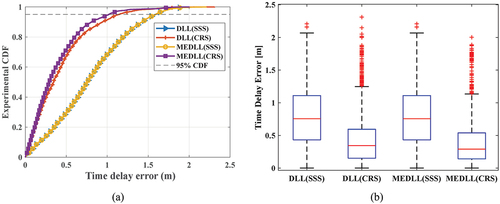
Table 2. The time delay error statistics in the static experiment.
Figure 10. Comparison of different signal results based on the DLL algorithm and MEDLL algorithm in mobile experiments. (a) the first mobile experiment. (b) the second mobile experiment.
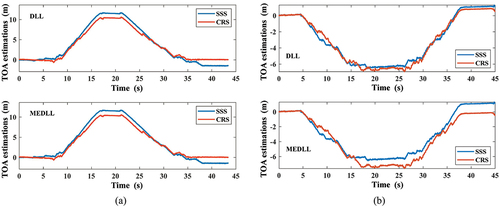
Figure 11. Comparison of the statistical results under moving conditions. (a) the CDF. (b) the boxplot.
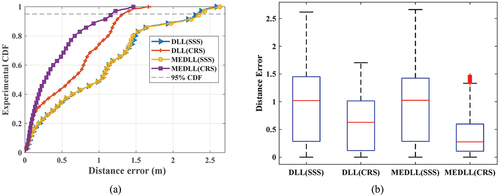
Table 3. The ranging estimation error statistics in mobile experiment.
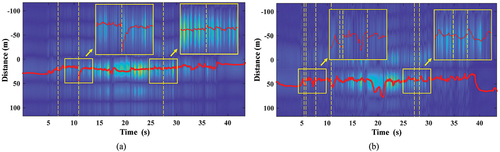
Figure 12. Results of the MEDLL algorithm for the extraction of multipath information. (a) the result of first path tracking. (b) the result of secondary path tracking. The blue background is the multipath signal energy separated by MEDLL, the red line is the position of the time delay at each moment, and the yellow dashed line is the time node at which the multipath anomaly detection algorithm detects the occurrence of path signal anomalies.
Data availability statement
The code applied in this study has not been made public because it involves subsequent research. Original data from part of the experiment can be obtained on reasonable request by contacting Zhaoliang Liu (E-mail: [email protected]).