
Figures & data
Figure 1. Land use types and sub-district boundary in Urumqi.
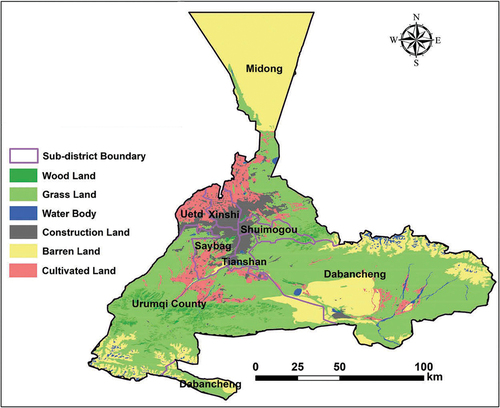
Figure 2. Random forest model flow chart.
Figure 3. Spatial distribution of ISAs in 2000 (a), 2005 (b), 2010 (c), 2015 (d), 2019 (e), and from 2000 to 2019 (f) in CFZ, FEZ, and NDZ of Urumqi.
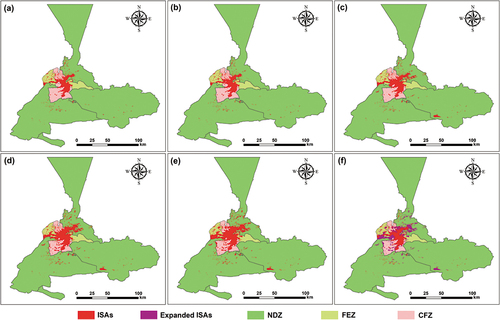
Figure 4. (a) Spatial distribution of mean NPP during 2000–2019 in Urumqi; (b) Pixel-wise spatial-temporal trend of annual NPP during 2000–2019 in Urumqi; (c) Inter-annual variations of NPP from 2000 to 2019.
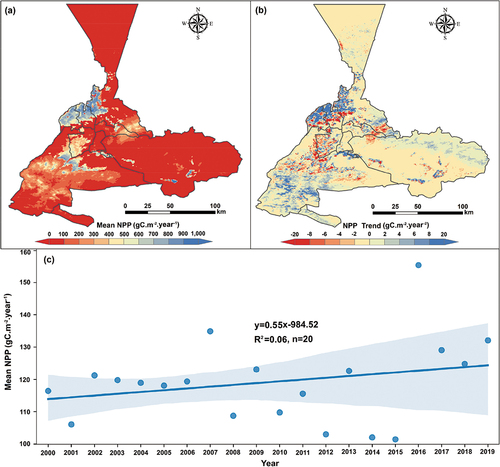
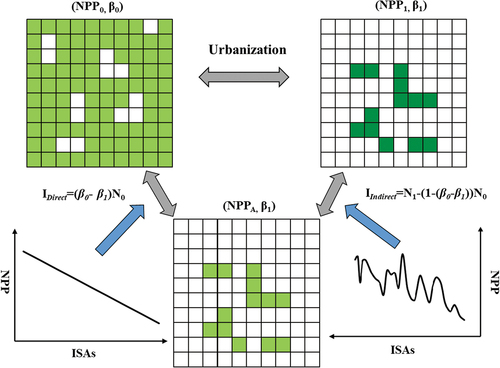
Figure 5. Conceptual diagram that reveals the impact of urbanization on vegetation carbon sequestration capacity in oasis cities.
Data availability statement
The multi-period Landsat images are available from https://www.usgs.gov/. Annual GPP derived from measurements at flux towers using the eddy covariance technique are available from the FLUXNET 2015 database and ChinaFlux database. Remotely sensed LAI are available from http://www.resdc.cn/data.aspx?DATAID=336. Daily maximum temperature, minimum temperature, solar radiation, precipitation, and daily average relative humidity are available from https://catalogue.ceda.ac.uk/uuid/10d2c73e5a7d46f4ada08b0a26302ef7. Soil datasets are available from http://www.fao.org/nr/lman/abst/lman_080701_en.htm.