
Figures & data
Table 1. Iridium STL signal system.
Figure 1. Block diagram of the OFDM system.
Figure 2. Block diagram of LSCC-BPR signal generation.
Figure 3. LSCC-BPR signal time-frequency structure.
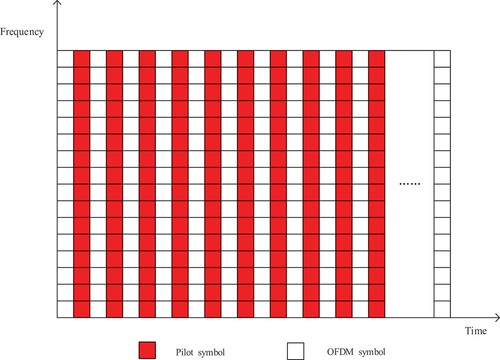
Figure 4. Schematic diagram of the LSCC-BPR signal structure. (a) Partial insertion of a pilot in front of the subcarrier. (b) Partial insertion of a pilot in the middle of the subcarrier. (c) Partial insertion of a pilot behind the subcarrier.
Figure 5. Block diagram of the traditional OFDM ranging system.
Figure 6. Ranging system of the LSCC-BPR signal.
Figure 7. Ranging algorithm flow based on the LSCC-BPR signal.
Figure 8. Time delay estimation based on fractional sampling. (a) When the number of carriers is 512. (b) When the number of carriers is 1024. (c) When the number of carriers is 2048. (d) When the number of carriers is 4096.
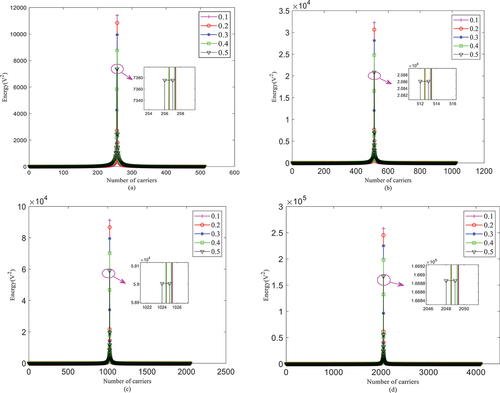
Figure 9. Simulation of time-domain delay estimation for different SNRs.(a) When the SNR is −5 dB. (b) When the SNR is −10 dB. (c) When the SNR is −15 dB. (d) When the SNR is −20 dB.
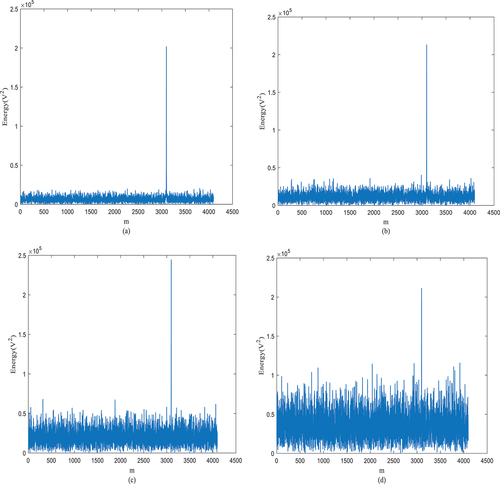
Figure 10. Relationship between L/N and ranging error.
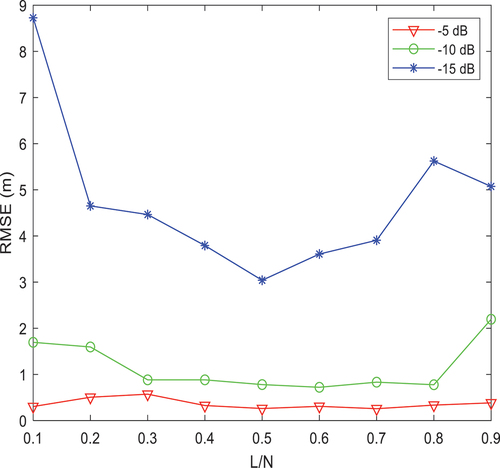
Figure 11. Relationship between ranging error and SNR for different numbers of subcarriers.
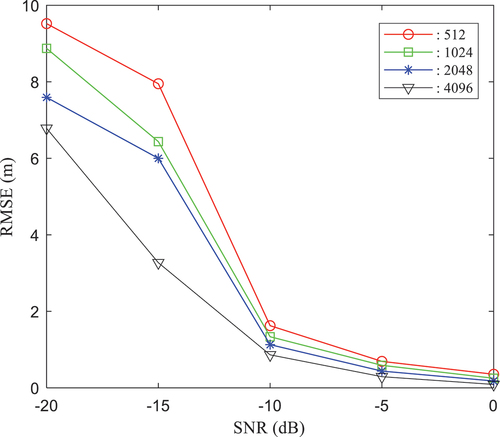
Figure 12. Relationship between ranging error and SNR when the ranging pilots are inserted in the front.
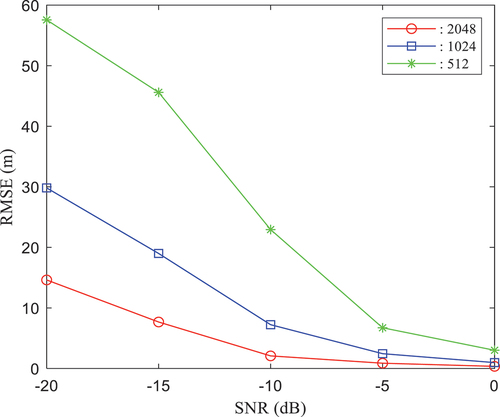
Figure 13. Relationship between ranging error and SNR when the pilots are inserted in the middle.
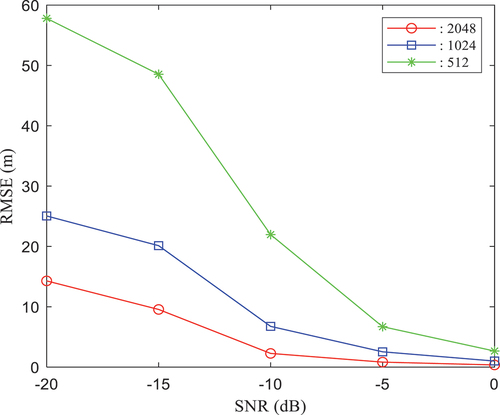
Figure 14. Relationship between ranging error and SNR when the pilots are inserted in the back.
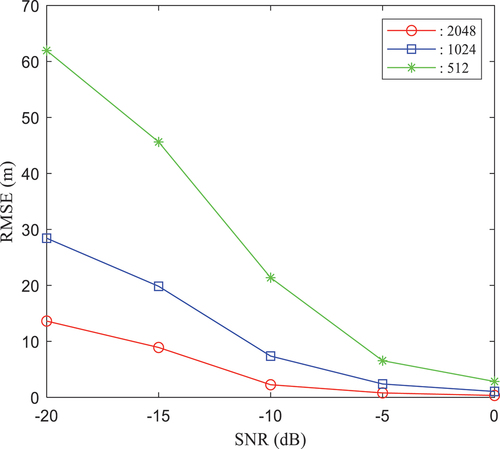
Figure 15. Relationship between the ranging error and SNR at different positions with 2048 pilots.
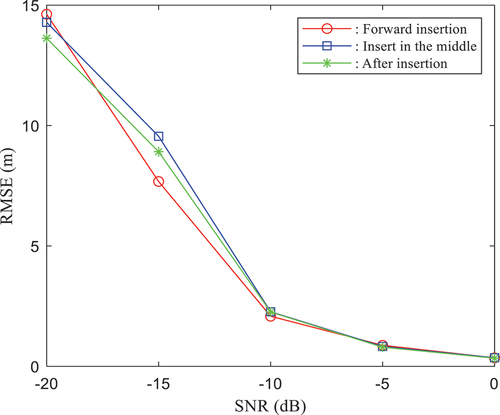
Figure 16. Relationship between the ranging error and SNR at different positions with 1024 pilots.
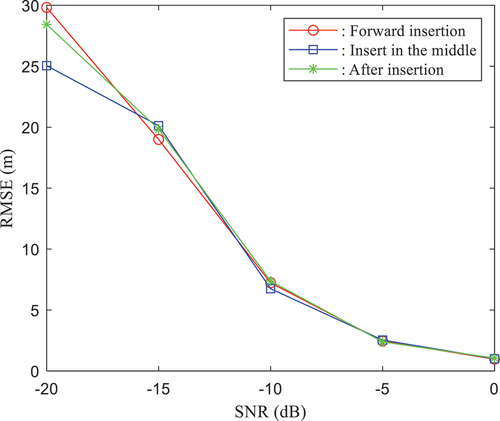
Figure 17. Relationship between the ranging error and SNR at different positions with 512 pilots.
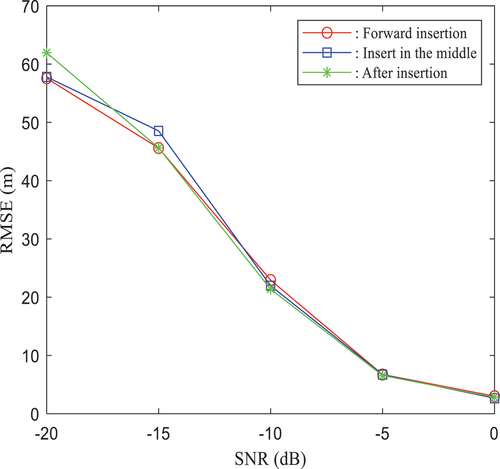
Figure 18. Effect of the Doppler shift on ranging accuracy.
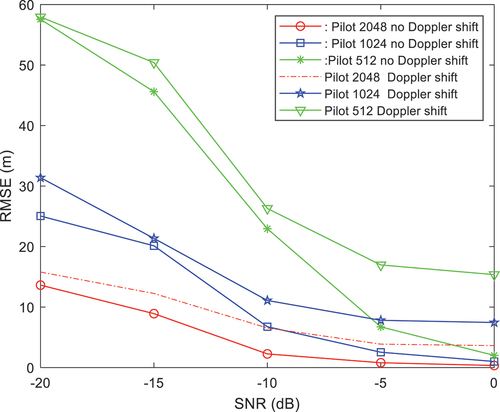
Figure 19. Ranging accuracy simulation based on the traditional OFDM signal and the LSCC-BPR signal.
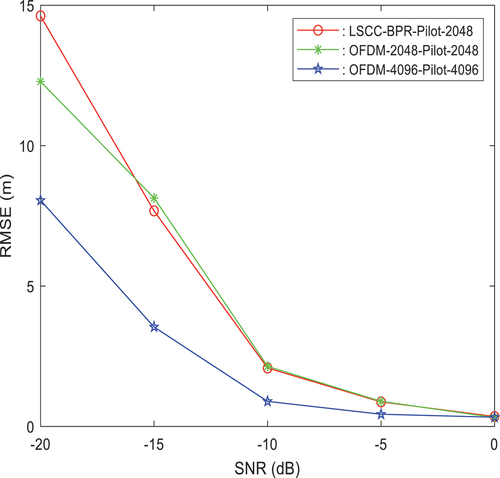
Figure 20. CSS signal time delay estimation with the SNR of 0 dB.
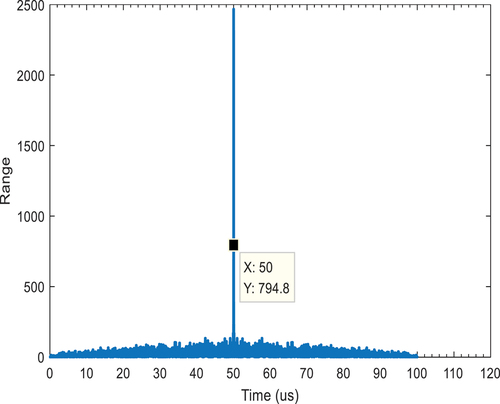
Table 2. Comparison of ranging performances of the CSS and LSCC-BPR signals.
Figure 21. Proportions of pilots, information, and subcarriers.
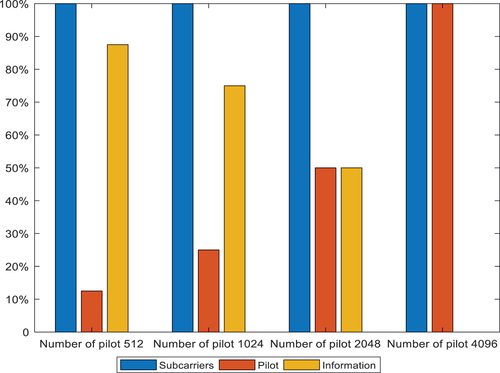
Table 3. Ranging accuracy for different numbers of pilots at an SNR of 0 dB.
Data availability statement
The data that support the findings of this study are available from the corresponding author upon reasonable request.