
Figures & data
Figure 1. The primary seas and straits through the NEP and the Eastern Arctic region. The red sector represents the study area and the red curve shows the NEP.
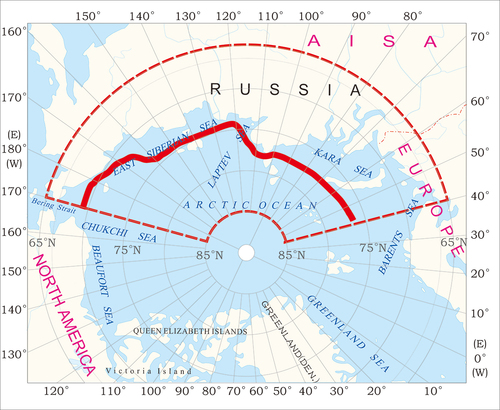
Table 1. Information of the passive microwave remote-sensing data.
Table 2. Linear regression coefficients for AMSR-E and SSMIS brightness temperature data.
Figure 2. Comparison of daily average brightness temperature before and after inter-calibration for AMSR-E and SSMIS.
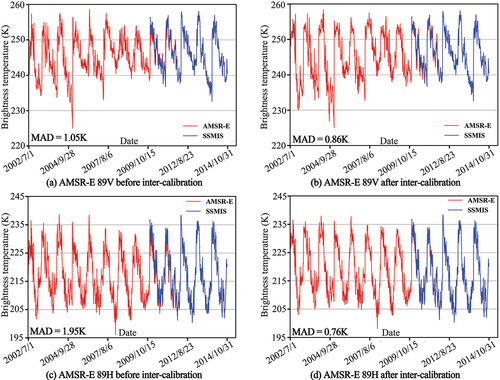
Table 3. Linear regression coefficients for AMSR2 and SSMIS brightness temperature data.
Figure 3. Comparison of daily average brightness temperature before and after calibration for AMSR2 and SSMIS.
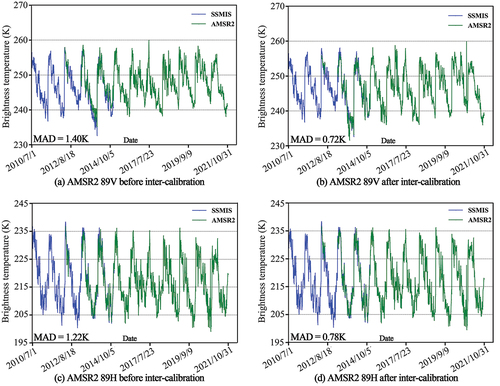
Figure 4. Variation of daily SIE from July to October of 2002–2006.
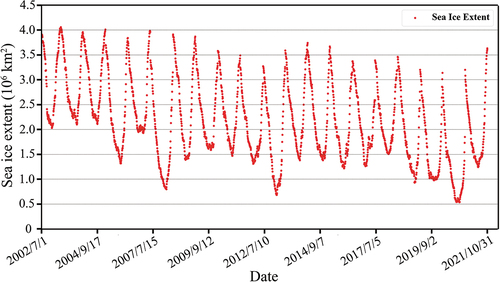
Figure 5. Maximum and minimum SIC during 2002–2021.
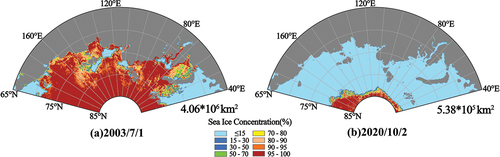
Figure 6. Variation of Monthly average SIE from July to October of 2002–2021.
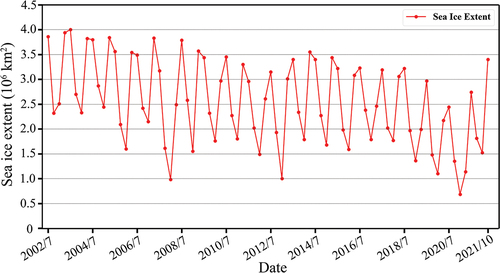
Figure 7. Monthly average SIE in September of 2002–2021.
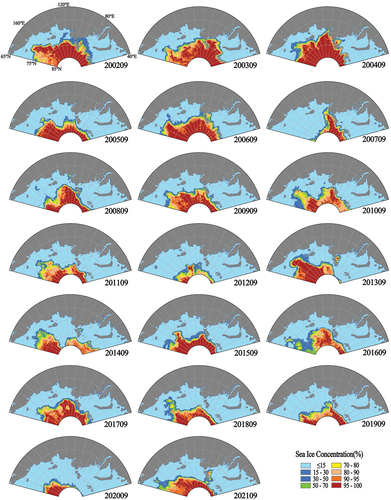
Figure 8. Variation of multi-year average SIE per ten days from July to October of 2002–2021.
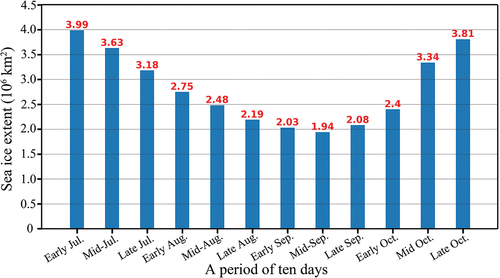
Figure 9. Multi-Year average SIC per ten days from July to October of 2002–2021.
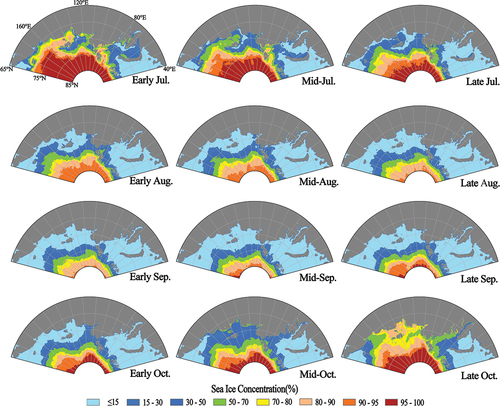
Figure 10. Variation of daily average thin SIT from July to October of 2002–2021.
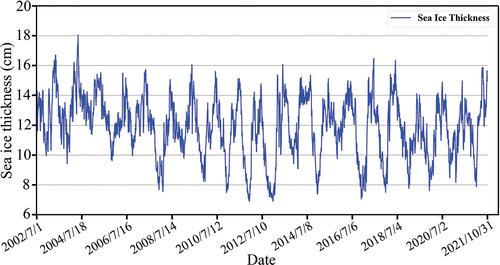
Figure 11. Spatial distribution of the maximum and minimum SIT.
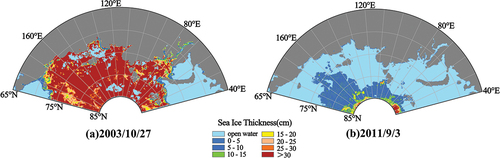
Figure 12. Spatial distribution of multi-year average SIT per ten days from July to October of 2002–2021.
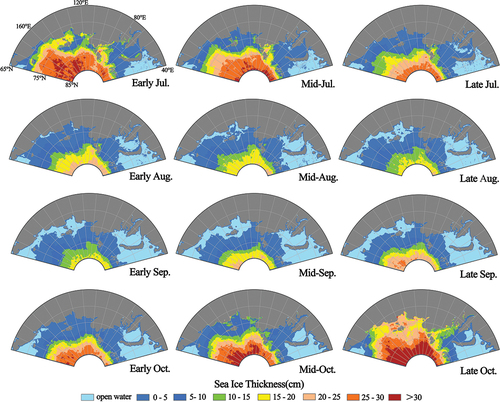
Figure 13. Navigation period of the NEP in summer seasons of 2002–2021.
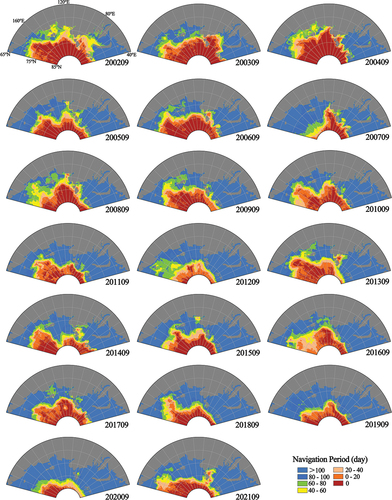
Figure 14. Navigation routes for the NEP in 2012, 2013, and 2015.
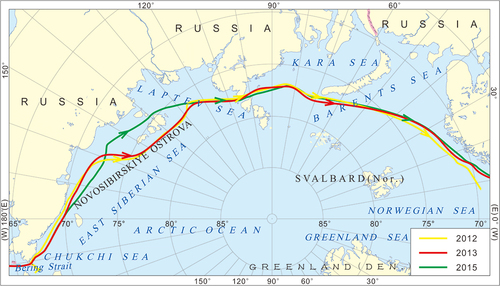
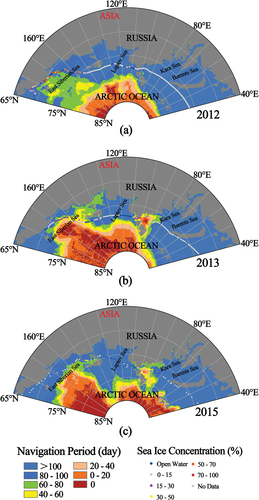
Figure 15. Navigation period and ship routes in 2012, 2013, and 2015. (a) Navigation period and R/V XueLong route in 2012; (b) Navigation period and M/V YongSheng route in 2013; (c) Navigation period and M/V YongSheng route in 2015.
Data availability statement
The AMSR-E and SSMIS dataset that support the findings of this study is openly available in https://nsidc.org/data/AE_SI12 and https://nsidc.org/data/NSIDC-0001 by the NSIDC, and the AMSR2 dataset that support the findings of this study is openly available in https://seaice.uni-bremen.de/data/amsr2 by the Bremen University. The ship-based SIC dataset that support the findings of this study is available from the corresponding author, upon reasonable request.