
Figures & data
Table 1. The classification of 337 cities in China.
Table 2. Relevant definitions for special terms in this study.
Figure 1. The study area in Taiyuan.
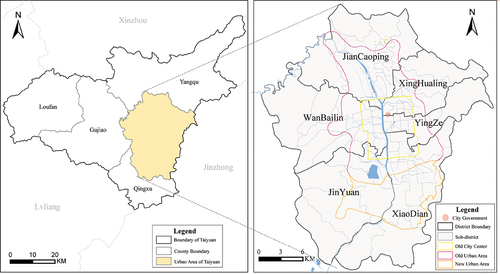
Table 3. Relevant descriptions of parks in Taiyuan.
Figure 2. Different types of parks in Taiyuan in 2018.
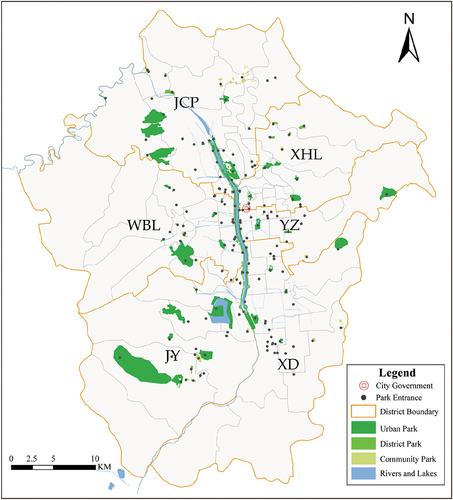
Table 4. Descriptive statistics of parks in Taiyuan’s districts in 2018.
Table 5. Descriptive statistics at the grid scale.
Figure 3. Distribution of commercial housing and rental housing in the study area in 2018.
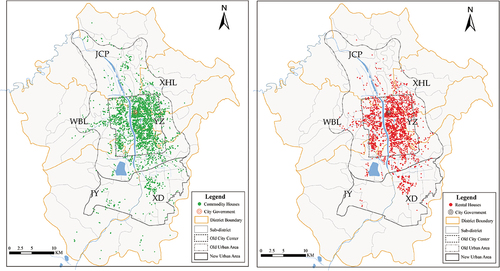
Figure 4. Population estimation in the study area: (a) Database creation, (b) Building exhibition, and (c) Population distribution in space.
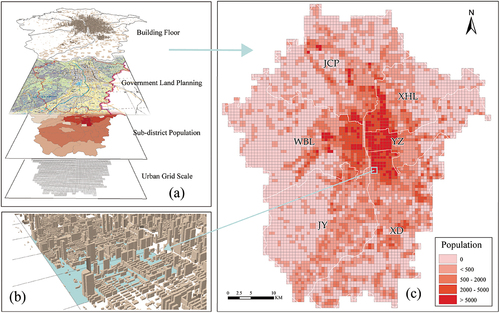
Table 6. The correlation coefficient between different types of population distribution and WorldPop2018.
Figure 5. Linear relationship between population distribution based on the sixth census and the WorldPop2018 in Taiyuan.
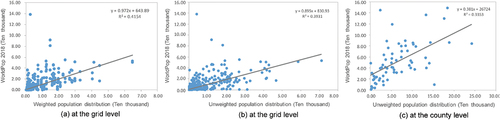
Figure 6. Research flowchart.
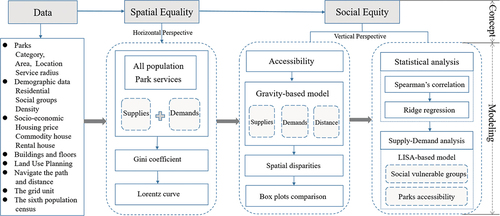
Figure 7. Gini coefficient and Lorenz curve.
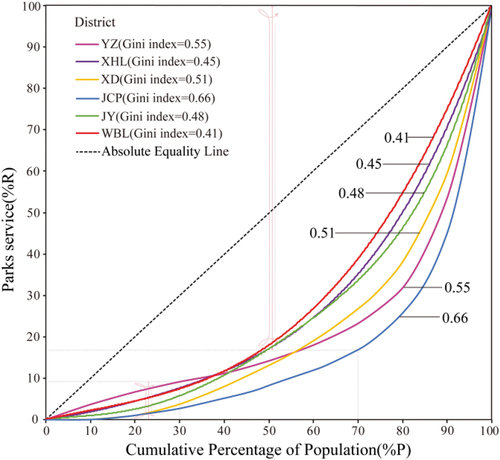
Figure 8. Spatial accessibility to different types of parks in Taiyuan (Quantile classification is used to divide the accessibility results into five categories): (a) is the accessibility to UPs (AUPs), (b) is the accessibility to DPs (ADPs), (c) is the accessibility to CPs (ACPs), and (d) is the total accessibility of parks (ATPs) in a certain area (the sum of the accessibility of three types of parks).
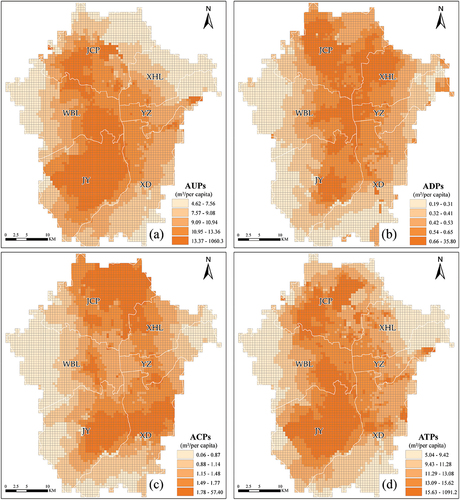
Figure 9. Accessibility of different types of parks per block group.
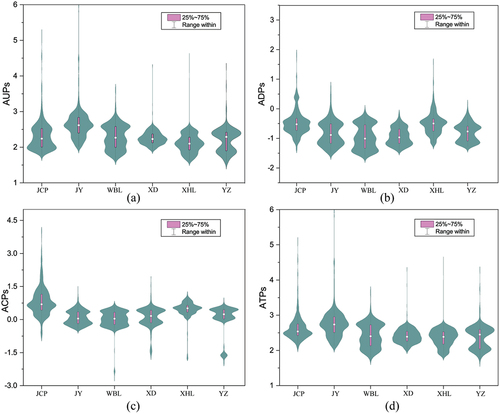
Figure 10. Box plot comparison of park accessibility in different districts.
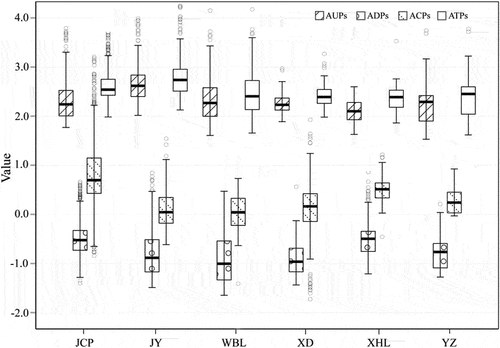
Figure 11. Spearman’s correlation coefficient results.
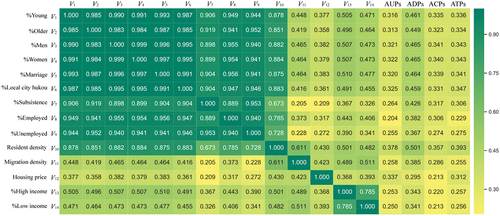
Figure 12. Ridge plots for different types of parks and variables.
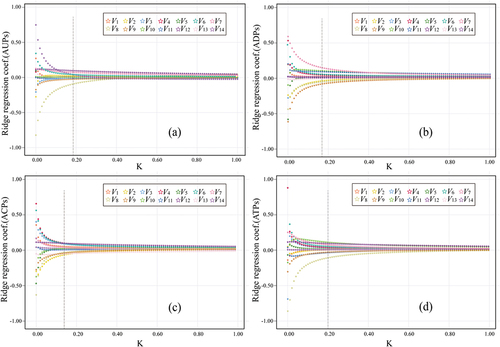
Table 7. Ridge regression results.
Figure 13. The relationship between adjusted R-square and K for different types of parks.
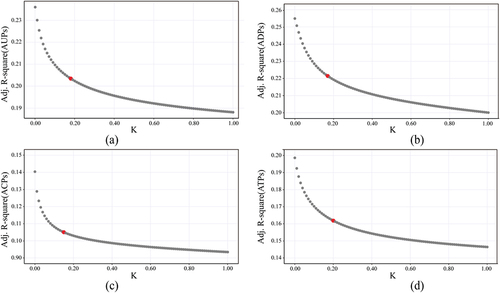
Figure 14. Bivariate LISA map of parks accessibility and statistically disadvantaged variables in Taiyuan (V2: %old; V5: %marriage; V8: %employed; V9: %unemployed; V11: Migration density).
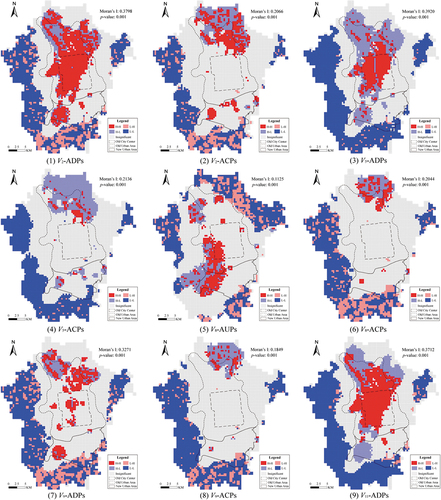
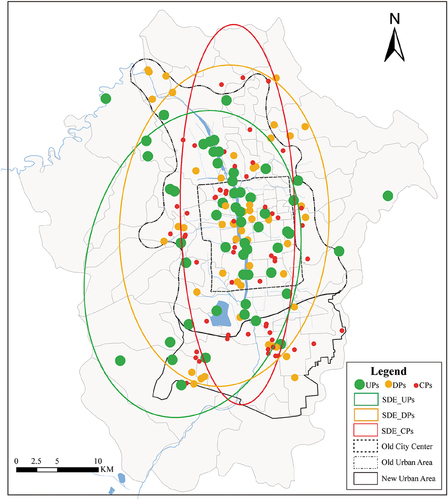
Figure 15. Spatial distribution of the center of gravity and direction of parks in Taiyuan.
Data availability statement
The data that support the findings of this study were derived from the National Bureau of Statistics at http://www.stats.gov.cn, the Taiyuan municipal government website at http://ylj.taiyuan.gov.cn/and other resources available in the public domain. Derived data are available from the corresponding author.