
Figures & data
Figure 1. An overview of the proposed SADGE: (a) the input multiple satellite images, (b) the initial DSM reconstructed with mSGM, (c) the final DSM after shading based refinement.
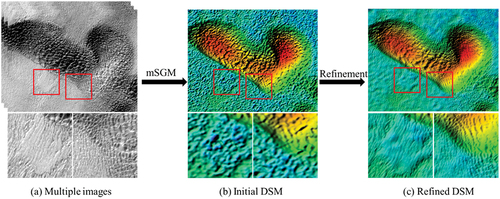
Figure 2. Results of the field area with the GaoFen-7 images. (a) The reference image, (b) the ground truth obtained with LiDAR, (c) the DSM generated with SURE, (d) the DSM generated with the proposed SADGE.
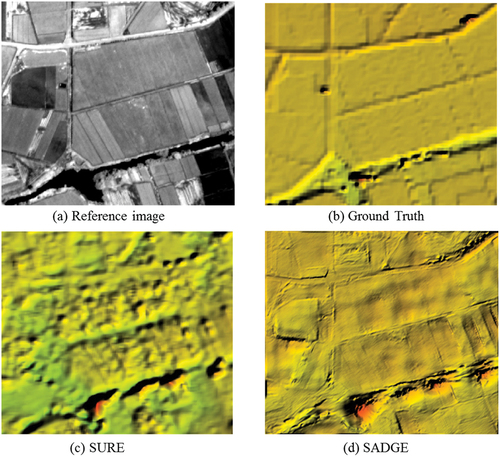
Figure 3. Results in Sainte-Maxime of France of the urban area. From top to bottom are the nadir ZiYuan-3 images (a), the rendered reference DSM based on French DSM (b), the rendered DSM generated by the proposed method (c), and the rendered DSM generated by SURE (d). The second and third columns are for the up and down small squares in the scene, respectively.
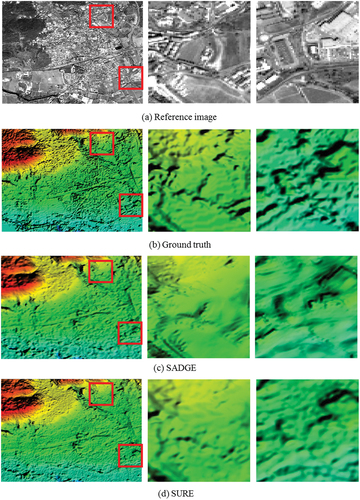
Figure 4. Results in Sainte-Maxime of France of the hill area. From top to bottom are the nadir ZiYuan-3 images (a), the rendered reference DSM based on French DSM (b), the rendered DSM generated by the proposed method (c), and the rendered DSM generated by SURE (d). The second and third columns are for the left and right small squares in the scene, respectively.
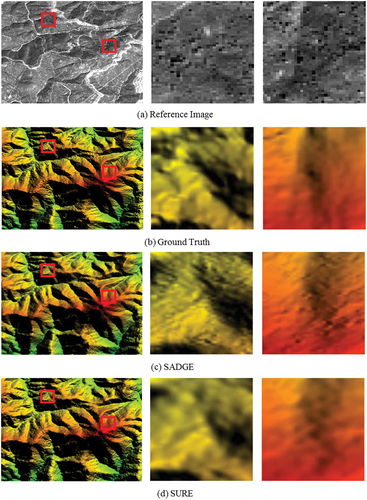
Figure 5. Accumulative distribution of the DSM errors of the DSM generated by SADGE and SURE in the field (a), urban (b), and hill areas (c).
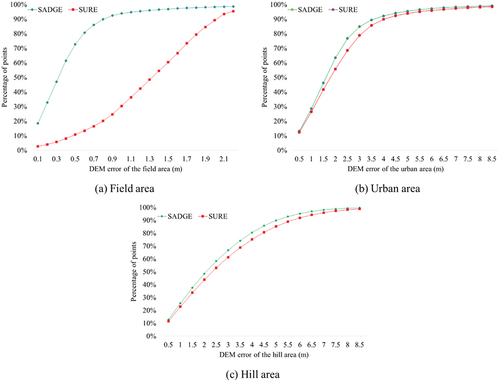
Table 1. Quantitative evaluation of SADGE and SURE.
Data availability statement
The Sainte-Maxime dataset used in the study is available from https://www.isprs.org/data/zy-3/Default-HongKong-StMaxime.aspx, other datasets are available from China Center For Resources Satellite Data and Application (CRESDA), http://www.cresda.com/CN/index.shtml, but restrictions apply to the availability of these data, which were used under license for this study.