
Figures & data
Figure 1. Spatial distribution of green space in Wuhan.
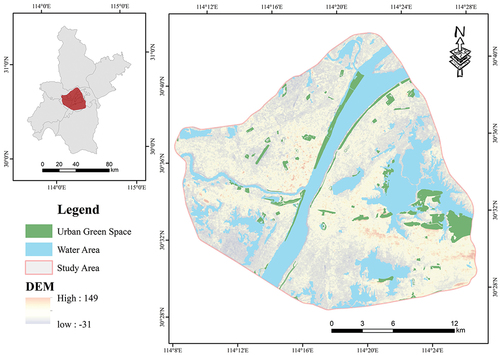
Figure 2. Coupling coordination analysis framework for spatial accessibility and ecological connectivity of UGSs.
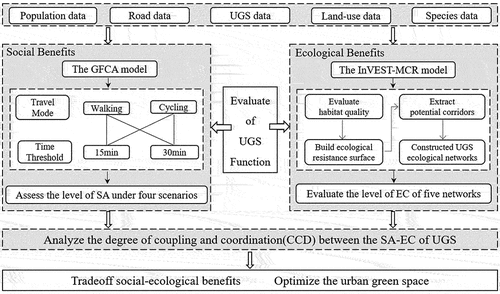
Table 1. Ecological characteristics of target species.
Table 2. Functional connectivity index and their expressions.
Table 3. The statistical description of spatial accessibility of UGSs in Wuhan.
Figure 3. Distribution of PGSs and AGSs under different accessibility levels.
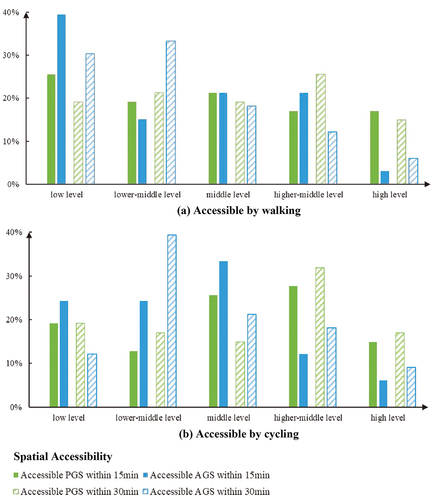
Figure 4. Spatial distribution of SA of UGSs in the urban center of Wuhan.
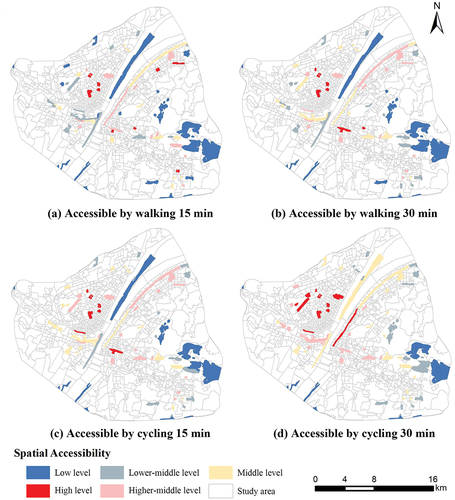
Figure 5. Ecological network of UGSs in the urban center of Wuhan under different dispersal distance thresholds.
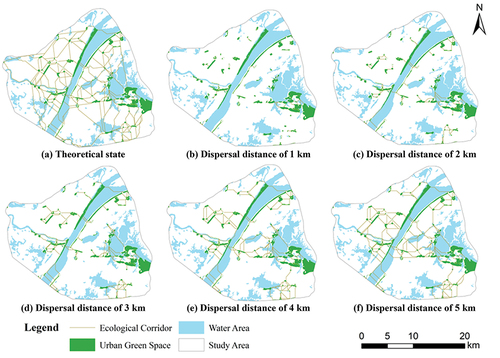
Table 4. Ecological connectivity of UGSs patches in Wuhan.
Figure 6. Spatial distribution of ecological connectivity of UGSs across all dispersal distance thresholds in Wuhan.
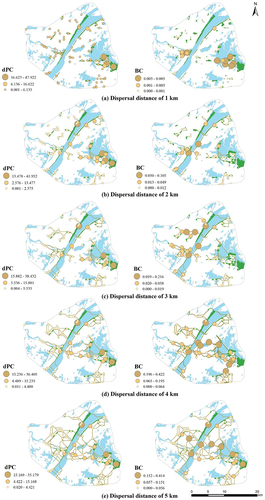
Figure 7. Numerical distribution of CCD under different traffic modes.
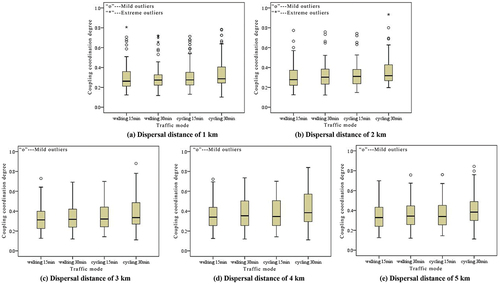
Figure 8. Numerical distribution of CCD under different species dispersal distances.
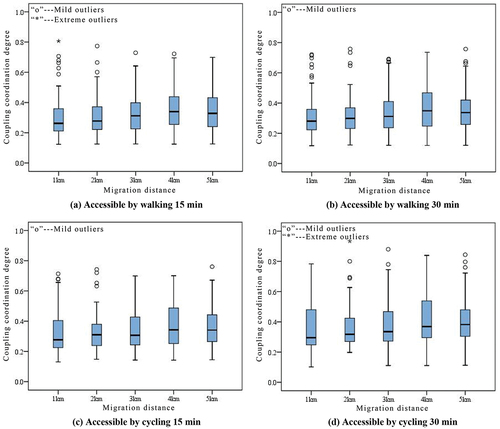
Figure 9. Coordination degree of UGSs in Wuhan.
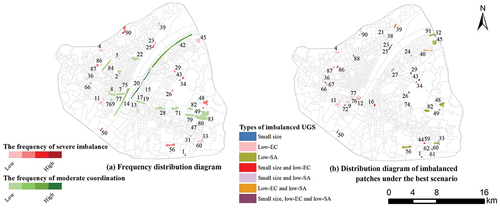
Table 5. Types of imbalanced green patches and key patches.
Data availability statement
The data that support the findings of this study are available from the corresponding author, upon reasonable request.