
Figures & data
Table 1. Summary of survey data.
Figure 1. Analysis target areas.
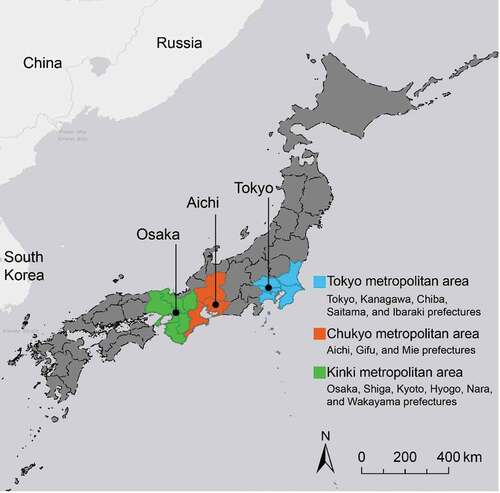
Figure 2. Aggregations of extracted shopping behaviors when undertaking shopping trips according to metropolitan area in terms of: (a) Sex, (b) Age, (c) Occupation, (d) Means of transportation (multiple responses allowed), (e) Departure time, (f) travel time (one-way average), (g) Travel distance (one-way average and straight-line distance calculated by coordinate), and (h) Stay time.
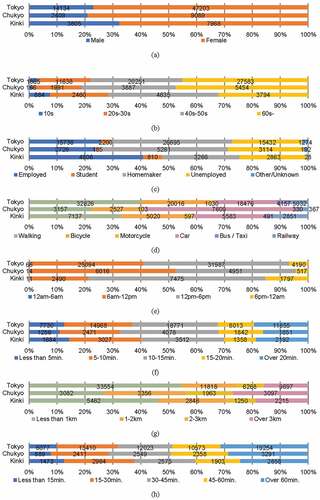
Figure 3. Aspects of undertaken shopping trips according to metropolitan area: (a) Distribution of travel time, (b) Distribution of stay time, and (c) Distribution of stay time/travel time ratio.
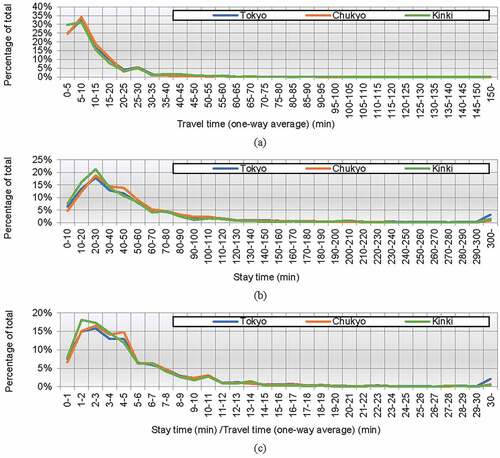
Figure 4. Distributions of travel and stay times on a natural log scale in the (a) Tokyo, (b) Chukyo, and (c) Kinki metropolitan areas. Note that transparency is assigned to each point according to data concentration, with darker points indicating a larger quantity of data.
Figure 5. Shopping behavior pattern clusters in the (a) Tokyo, (b) Chukyo, and (c) Kinki metropolitan areas.
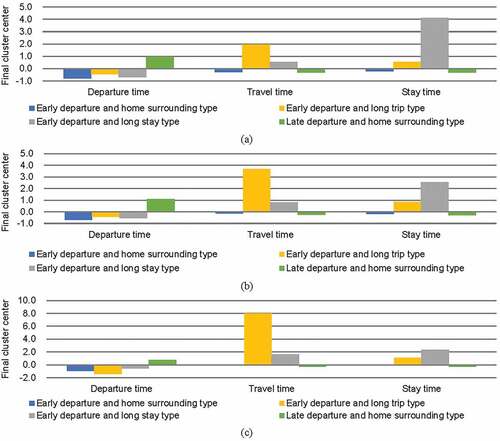
Table 2. Number and percentage of cases in each cluster.
Table 3. Relationship between travel time and stay time.
Table 4. Relationship between all variables and stay time.
Table 5. Relationship between travel time and stay time according to shopping behavior pattern.
Data availability statement
The data that support the findings of this study are available from the CSIS of the University of Tokyo, but restrictions apply to the availability of these data, which were used under license for the current study and are not publicly available. Data are however available from the author upon reasonable request and with permission of CSIS.