
Figures & data
Figure 1. Flowchart of digital orthophoto map (DOM) generation.
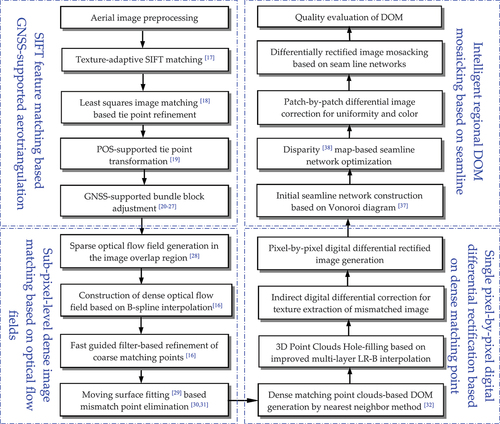
Figure 2. Flowchart of 3D point cloud completion.
Figure 3. Knot insertion of a B-spline curve.
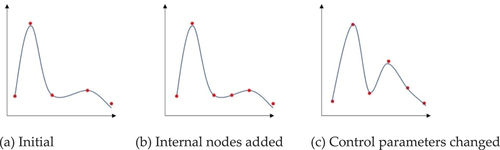
Figure 4. 3D point clouds completion.
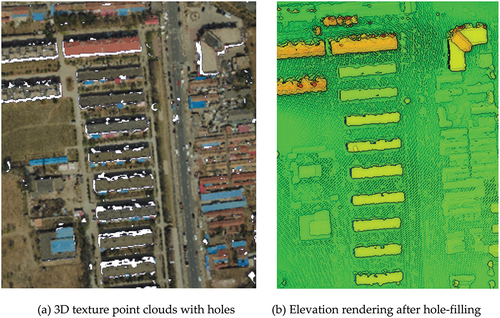
Figure 5. Flowchart of the seamline network optimization.
Figure 6. Fully automatic extraction of the seamline network in a dense area of buildings.
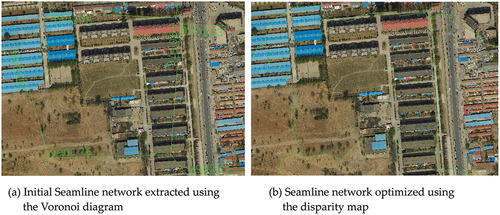
Table 1. Parameters for the two sets of experimental images.
Figure 7. Doms of ten typical surface features generated by the fully automatic method proposed in this paper.
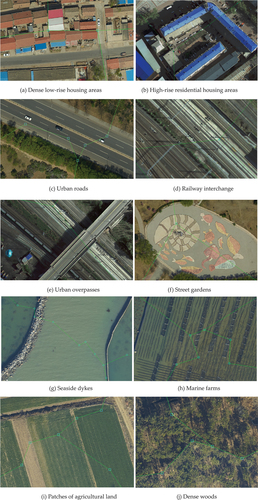
Figure 8. Mosaic accuracy curves and histograms between differential rectification images.
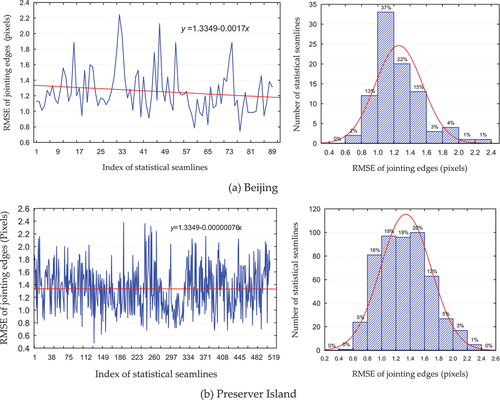
Table 2. DOM accuracy for the two experimental areas.
Figure 9. Visual comparison of the automatically generated DOMs on the Vahingen dataset.
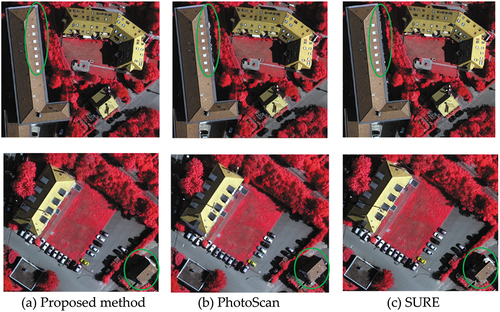
Table 3. Quantitative comparison of the three methods.
Data availability statement
Some data that support the results and analyses presented in this paper are freely available online (URLs: https://pan.baidu.com/s/1mQCQNjW9eGaesfxsYQqcaw Password: hsly). Others cannot be shared at this time, as the data also form part of an ongoing study.