
Figures & data
Figure 1. Monthly ODT flows between Puerto Rico and the US.
Figure 2. Difference in travel flows from Puerto Rico to the contiguous US calculated as pre-pandemic flow minus peri-pandemic flow.
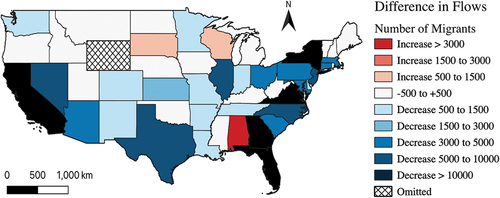
Table 1. Official definitions of the chosen variables from the CDC’s SVI (Flanagan et al. Citation2011) and how they impact travel decisions.
Table 2. O-C model-generated coefficients for the pre-pandemic and peri-pandemic periods.
Table 3. D-C model-generated coefficients for the pre-pandemic and peri-pandemic periods.
Figure 3. Coefficients of COVID-19 variables new cases (light blue bar) and new deaths (dark blue bar) by month. All coefficients were significant at the 0.001 level. Raw numbers of new cases and new deaths are included as light blue and dark blue lines, respectively. New case number was scaled down by a factor of 50 to show trends.
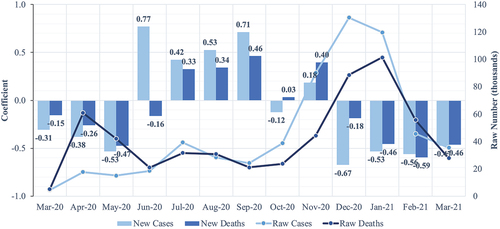
Figure 4. O-C model-produced coefficients for variables destination pop, % PR pop at D, and Euclidean distance, separated by month for pre-pandemic in gray and peri-pandemic in blue.
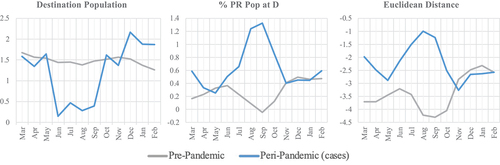
Figure 5. D-C model-produced coefficients for variables first leg and Euclidean distance separated by month for pre-pandemic in gray and peri-pandemic in blue.
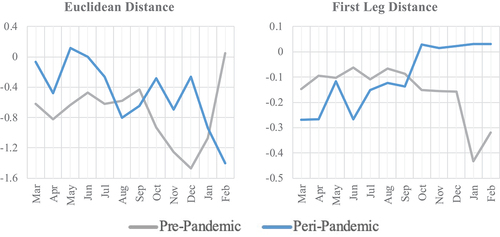
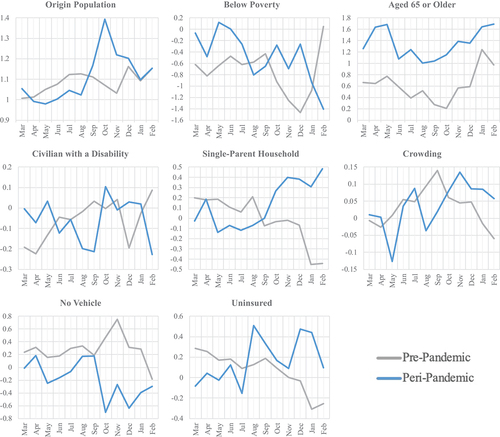
Figure 6. D-C model-produced coefficients for variables origin pop and chosen SVI variables separated by month for pre-pandemic in gray and peri-pandemic in blue.
Data availability statement
The data that support the findings of this study are openly available from the following locations: 1) US Census Bureau in [https://data.census.gov/cedsci/table?q=mobility&g=0400000US72&tid=ACSDT1Y2019.B07204PR&tp=true], reference number [B07204PR]; 2) CDC Case Task Force in [https://data.cdc.gov/Case-Surveillance/United-States-COVID-19-Cases-and-Deaths-by-State-o/9mfq-cb36], reference number [Centers for Disease Control and Prevention (009:20)]; 3) CDC/ATSDR Social Vulnerability Index in [https://www.atsdr.cdc.gov/placeandhealth/svi/data_documentation_download.html]; and 4) ODT Flow Explorer in [http://gis.cas.sc.edu/GeoAnalytics/od.html].