
Figures & data
Figure 1. Developmental line of existing popular RS-CCPs.
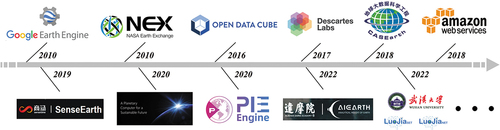
Figure 2. A simplified platform diagram of LuoJiaAI.
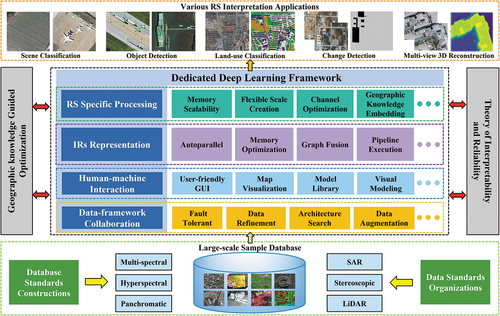
Figure 3. Logical model of sample type.
Figure 4. Sample classification framework.
Figure 5. Flowchart of multi-source sample data integration.
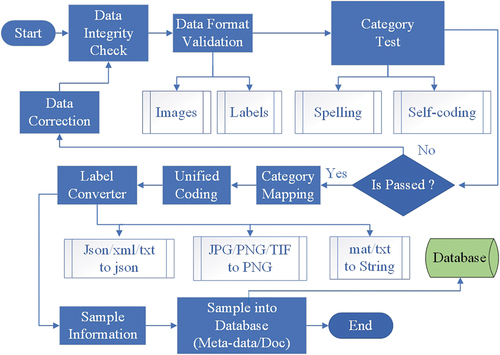
Figure 6. Technical flow diagram of automatic/semi-automatic combined labeling.
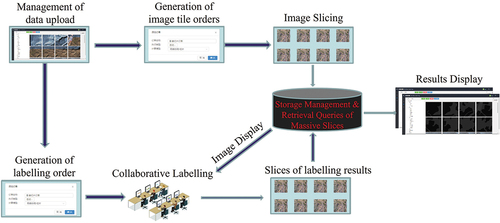
Figure 7. Overall framework of the sample sharing service.
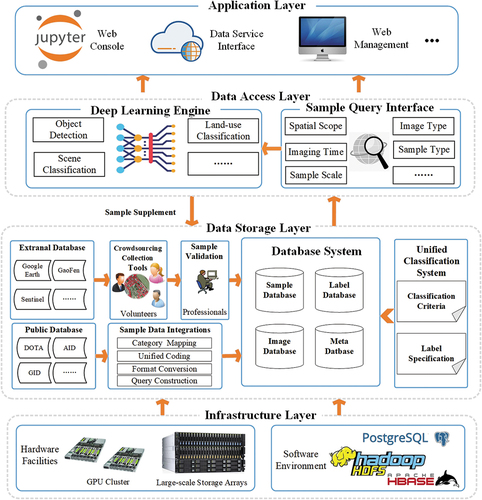
Figure 8. Dataset statistics in LuoJiaSET platform.
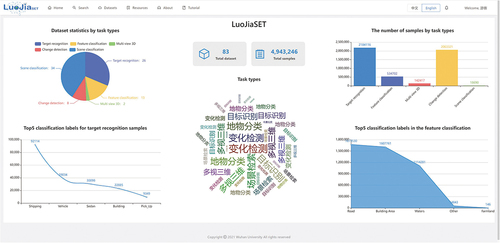
Figure 9. Sample query interface in LuoJiaSET platform.
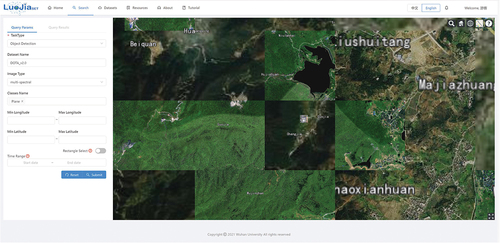
Figure 10. Dataset information displayed in LuoJiaSET platform.
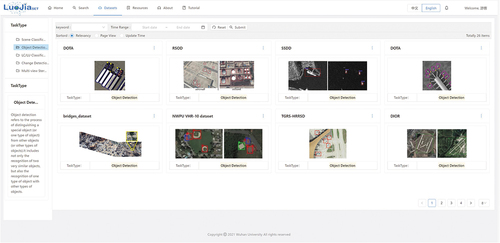
Figure 11. High-level service APIs in LuoJiaSET platform.
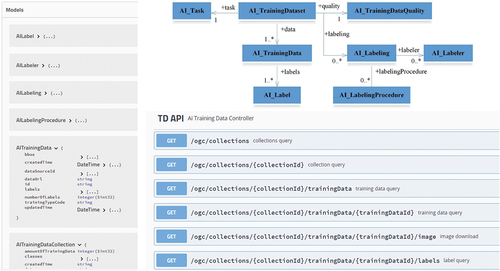
Figure 12. Simplified system architecture diagram for LuoJiaNET.
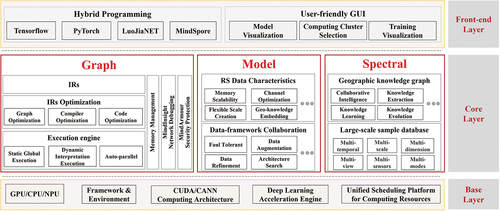
Figure 13. Process of IBGM method in memory scalability module for large-scale image processing.
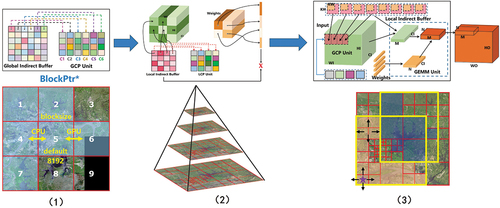
Figure 14. Visualization of different large-scale image processing methods on GID.
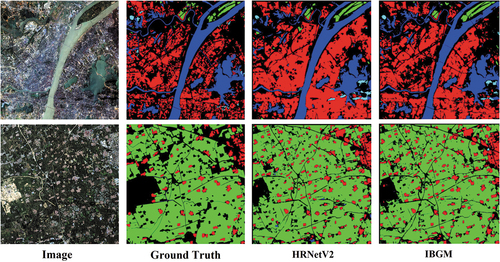
Table 1. Land-use classification results on GID with HRNetV2 model.
Figure 15. Workflow of distributed parallel computing strategy.
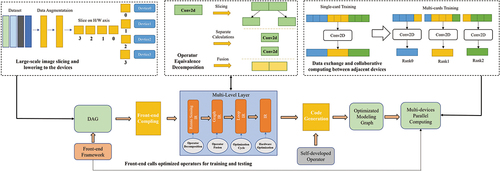
Figure 16. Visualization of different large-scale image processing methods on GID.
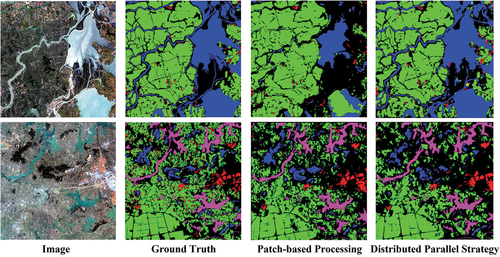
Table 2. Land-use classification results on GID with FCN8s model.
Figure 17. Process of adaptive optimization method for optimizing multi-scale and multi-channel image features.
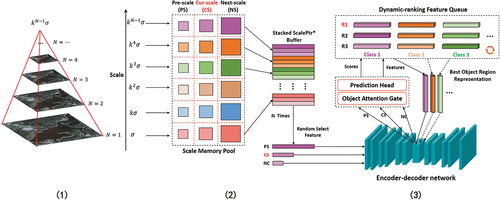
Figure 18. Visualization of the adaptive optimization method on WHU-Hi.
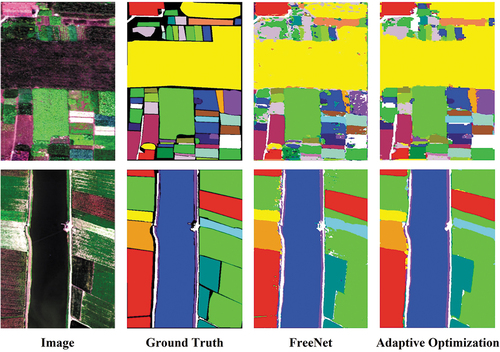
Table 3. Land-use classification results on WHU-Hi with FreeNet model.
Figure 19. Auto-parallel computing strategy embedding prior geographic knowledge.
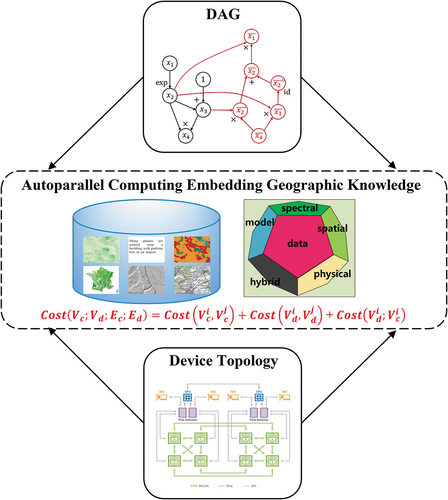
Table 4. Scene classification results on WHU-RS19 with different parallel computing strategies.
Figure 20. Overall architecture of the LuoJiaNET’s front-end application.
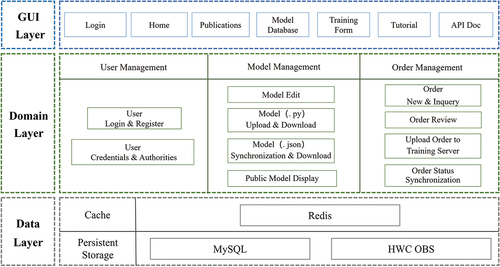
Figure 21. Main page of the front-end application, with object detection taken as an example.
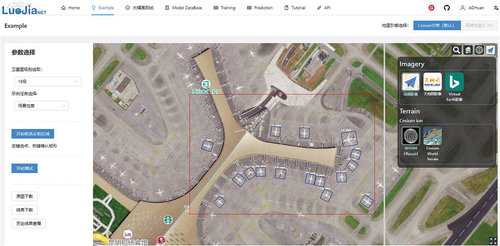
Figure 22. Model database of LuoJiaNET.
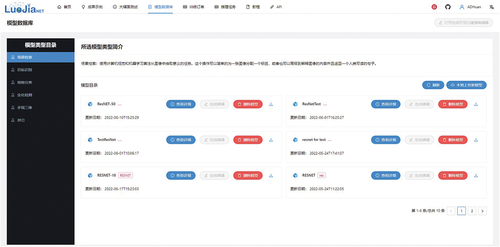
Figure 23. Overall architecture of the LuoJiaNET’s visual modeling tool.
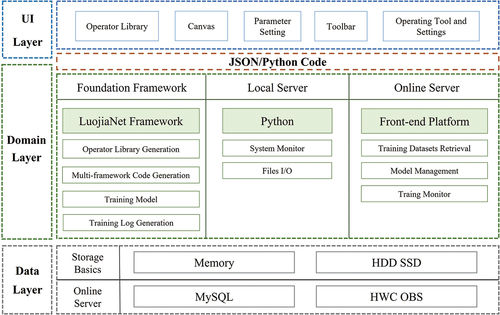
Figure 24. Main view of visual modeling tool.
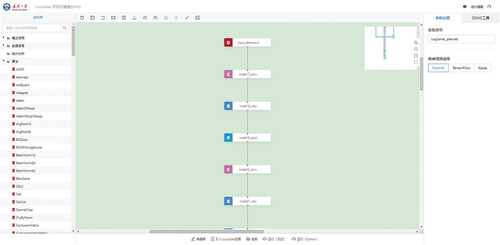
Figure 25. Visualization on AID using ResNet-50 in scene classification task.
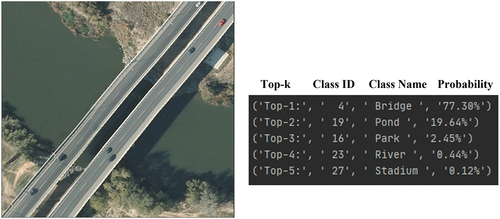
Figure 26. Visualization on DOTAV2.0 (Ding et al. Citation2021) using Mask-RCNN (He et al. Citation2017) in object detection task.
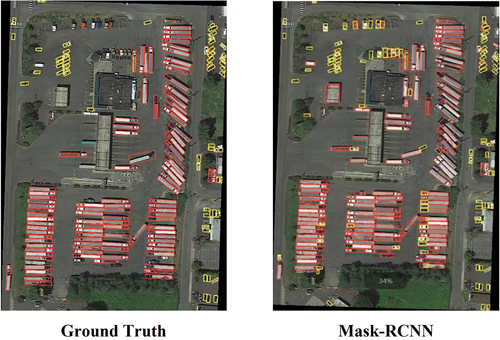
Figure 27. Visualization on ISPRS-Vaihingen (Rottensteiner et al. Citation2012) using U-Net (Ronneberger, Fischer, and Brox Citation2015) and DeepLabV3+ (Chen et al. Citation2018) in land-use classification task.
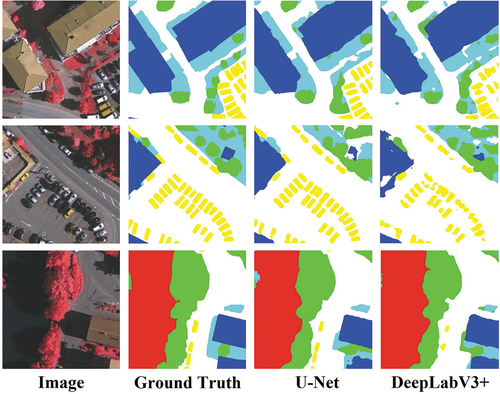
Figure 28. Visualization on WHU-BCD using DTCDSCN (Liu et al. Citation2020) in change detection task.
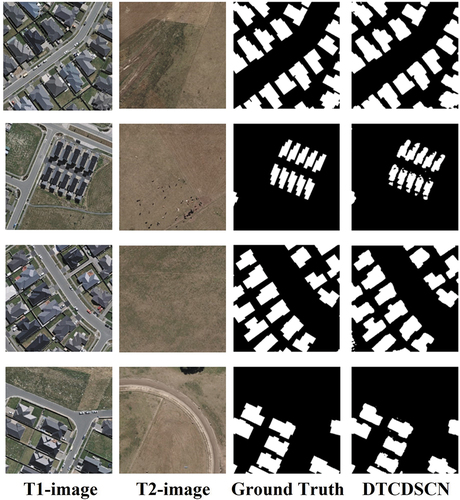
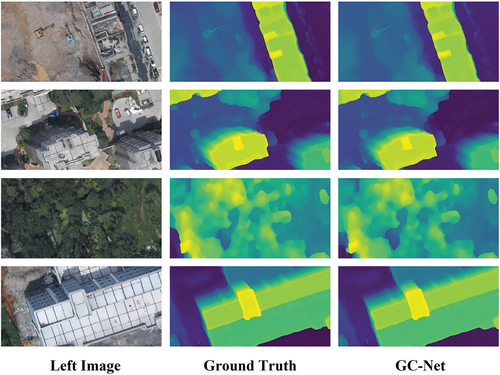
Figure 29. Visualization on WHU-Stereo (Li et al. Citation2022) using GC-Net (Ni et al. Citation2020) in multi-view 3D reconstruction task.
Data availability statement
The data that support the findings of this study are available on GitHub at https://github.com/WHULuoJiaTeam.