
Figures & data
Figure 1. Spatial distributions of 31 Chinese municipalities and provincial capitals in China.
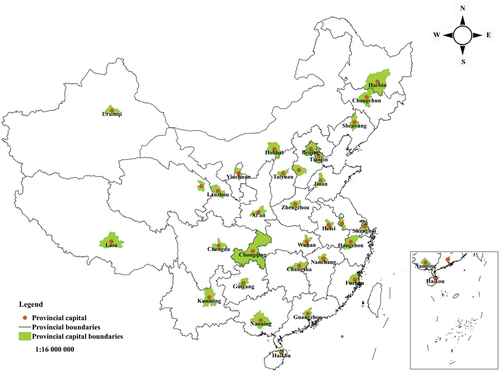
Table 1. Introduction for data source.
Figure 2. Flow chart for calculating and analyzing urban sprawl.
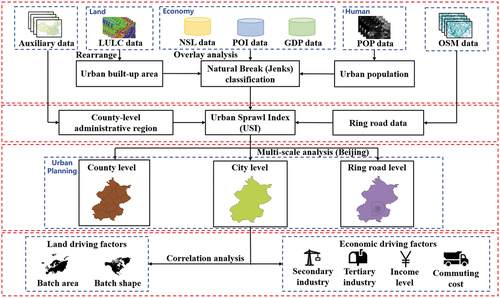
Figure 3. Identification of ring roads and counties, using Beijing as an example.
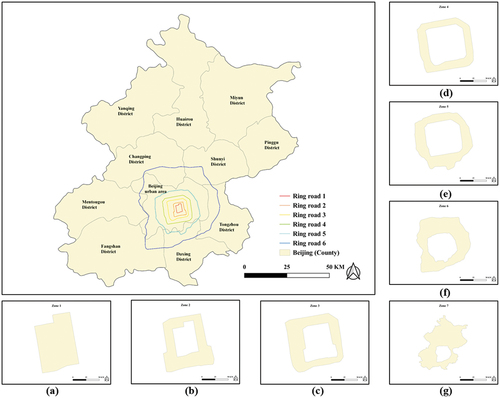
Figure 4. The CRC framework for analyzing urban sprawl.
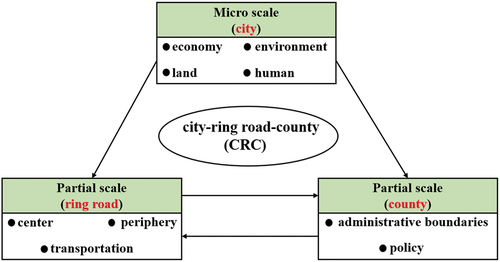
Table 2. Driving indicators for urban sprawl.
Figure 5. Maps of the variable urban sprawl, and constant in each of the 31 municipalities and provincial capitals in 2005(a), 2010(b) and 2015(c). For each map, the values are represented by colors, with the maximum values in red and the minimum values in green.
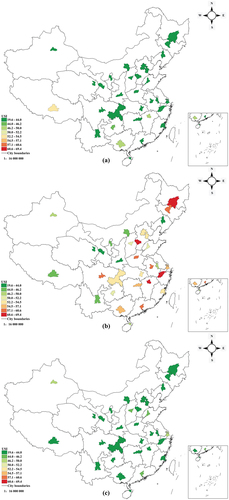
Table 3. Urban sprawl for 31 municipalities and provincial capitals.
Table 4. Urban sprawl for eastern municipalities and provincial capitals.
Table 5. Urban sprawl for central municipalities and provincial capitals.
Table 6. Urban sprawl for western municipalities and provincial capitals.
Table 7. Urban sprawl for northeastern municipalities and provincial capitals.
Figure 6. Maps of the USI in Beijing, Shanghai, Guangzhou, Wuhan, Chengdu, Xi’an, and Shenyang at the ring road scale.
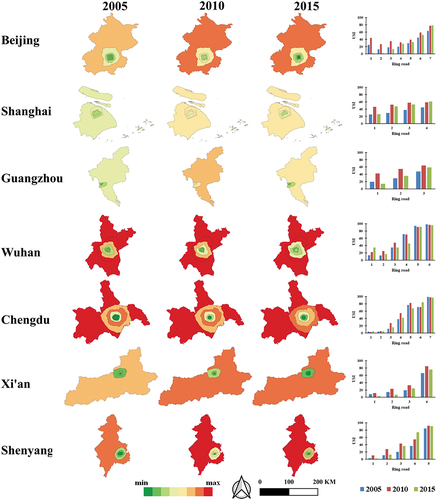
Figure 7. Maps of the USI in Beijing, Shanghai, Guangzhou, Nanjing, Changsha, Tianjin, Hefei, Nanchang, and Guiyang at the county scale (Tianjin Tanggu District, Hangu District and Dagang District were merged into Binhai New Area in 2009 and are still divided into three districts for the purpose of comparison; Nanchang’s administrative divisions are constantly evolving, so use 2005 as a standard for comparison).
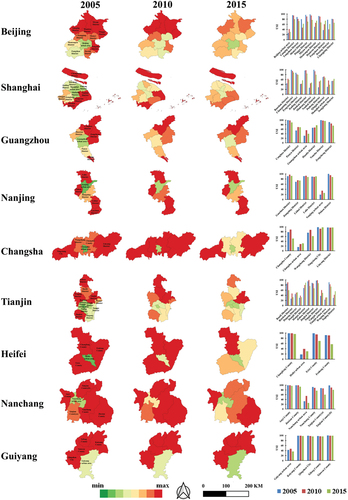
Table 8. Descriptive statistics for urban sprawl index and driving indicators.
Table 9. Relationships between urban sprawl and driving indicators.
Data availability statement
Some data that support the results and analyses presented in this paper is publicly available from the Institute of Geographic Sciences and Resources, Chinese Academy of Sciences (http://www.resdc.cn/). The administrative boundary data including provincial and regional boundaries are publicly available from the National Geographic Information Center of China (http://ngcc.sbsm.gov.cn).