
Figures & data
Figure 1. Workflow of BA.
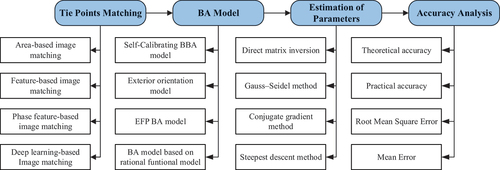
Figure 2. Distribution of residual elevation before and after the introduction of laser points in the test area of Shandong Province.
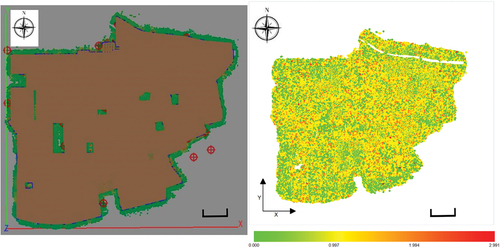
Table 1. Statistical table of checkpoint accuracy (m).
Figure 3. 13th Cave of Yungang Grottoes and data collection site.
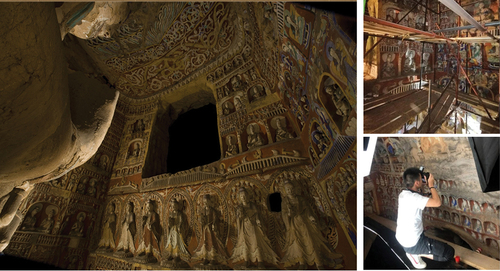
Figure 4. Schematic diagram of aerial triangulation.
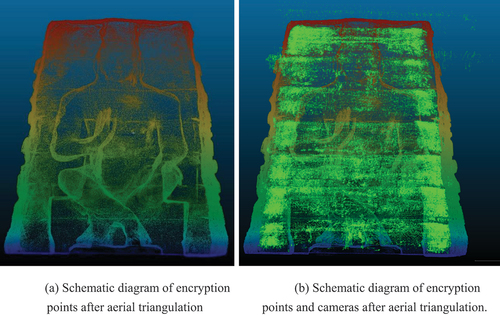
Table 2. Checkpoint accuracy.
Data availability statement
The ZY-3 stereo imagery data that support the findings of this study are restricted in access and use, but can be queried and requested from the website of the China Centre for Resources Satellite Data and Application (CRESDA) (http://www.cresda.com/EN/) and Chinese Natural Resources Satellite Remote Sensing Cloud Service Platform (http://sasclouds.com/chinese/normal/). The GLAS/ICESat data are openly available and can be acquired from the National Snow & Ice Data Center (NSIDC) at https://nsidc.org/data/.