
Figures & data
Table 1. Data fields in the santander cycles dataset.
Table 2. Descriptive statistics of filtered BSS trips.
Table 3. Time periods for analysis based on London’s lockdown timeline.
Figure 1. Daily temporal trend of bike share usage from 2019 to 2021.
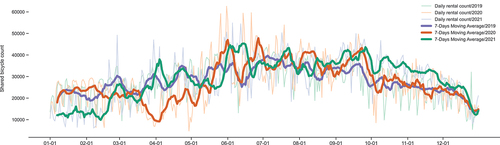
Figure 2. Monthly temporal trend of bike share usage from 2019 to 2021.
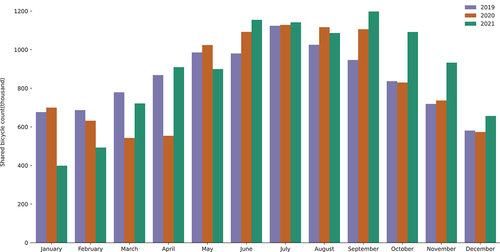
Figure 3. The total number of bike hire trips by day of the week in each month from 2019 to 2021.
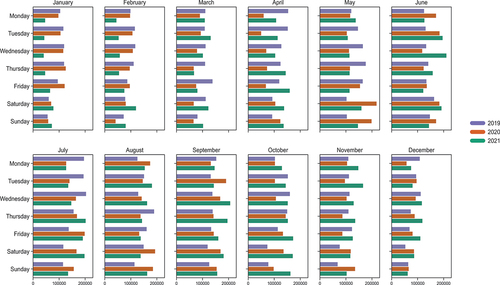
Figure 4. BIC score of GMM model selection.
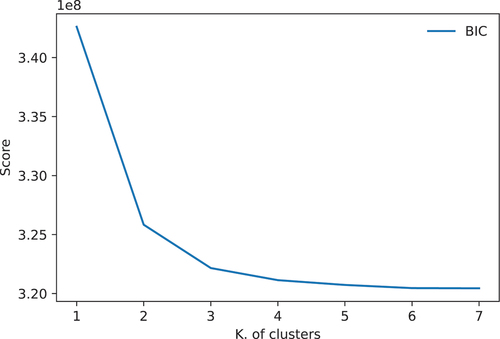
Figure 5. The scatter plot of overall 2020 trips with the pre-trained GMM model.
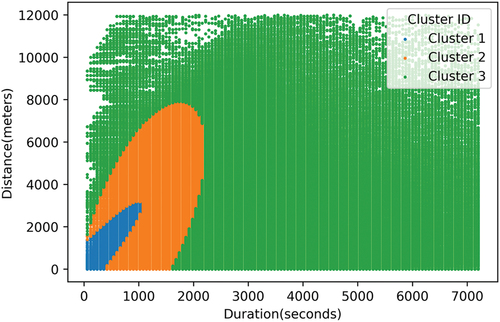
Figure 6. Total hourly trip counts in Cluster 1 per month of 2019, 2020, and 2021.
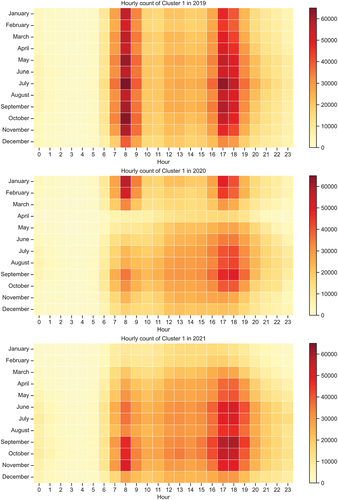
Figure 7. Total hourly trip counts in Cluster 2 per month of 2019, 2020, and 2021.
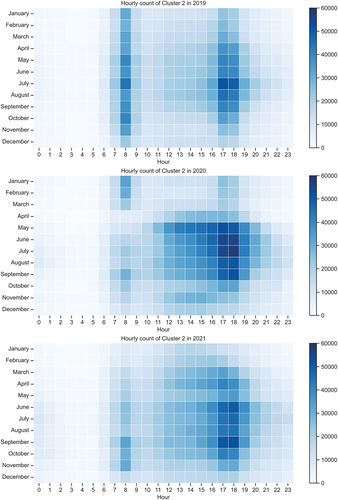
Figure 8. Total hourly trip counts in Cluster 3 per month of 2019, 2020, and 2021.
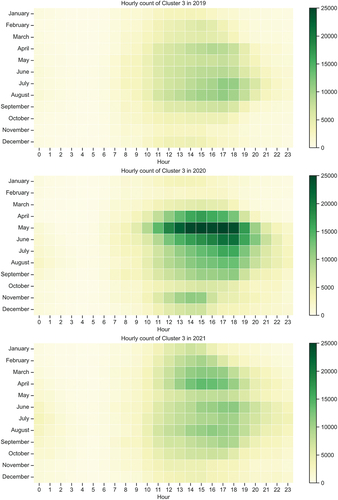
Figure 9. Change ratios (%) in the trips of each cluster among each period compared with 2019.
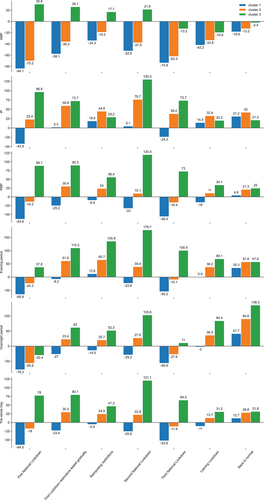
Figure 10. Spatial patterns of top 1% of OD flows in the Cluster 1 (a) C1-amp (b) C1-IP (c) C1-PMP.
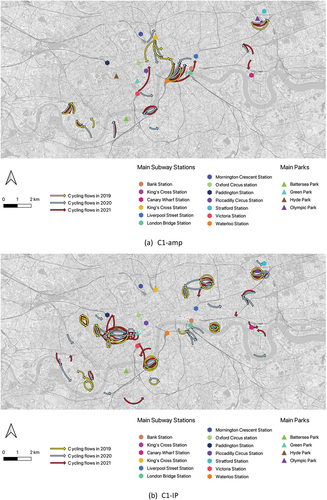
Figure 10. (Continued).
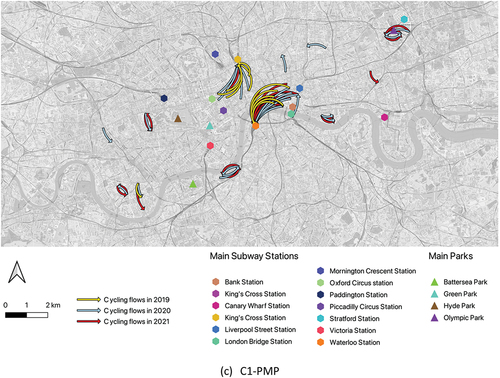
Figure 11. Spatial patterns of top 1% of OD flows in the Cluster 2 (a) C2-AMP (b) C2-IP (c) C2-PMP.
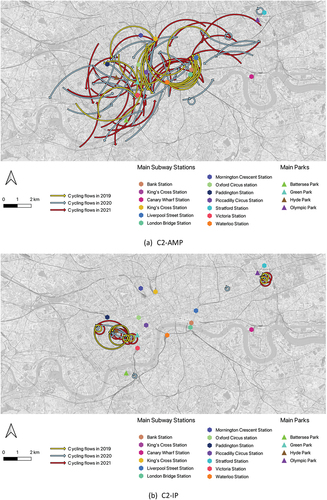
Figure 11. (Continued).
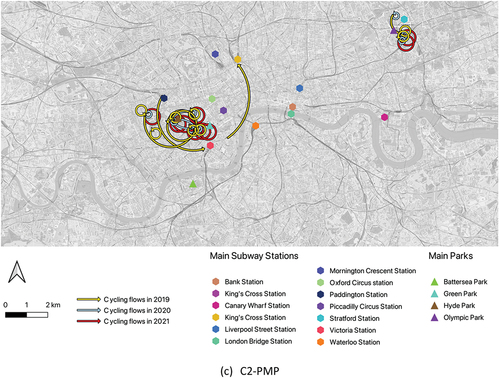
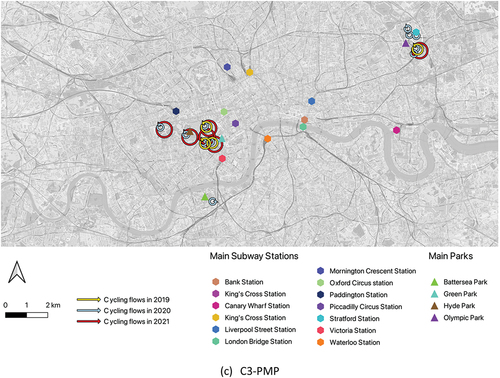
Figure 12. Spatial patterns of top 5% of OD flows in the Cluster 3 (a) C3-AMP (b) C3-IP (c) C3-PMP.
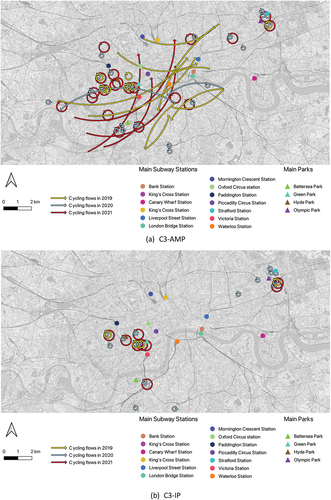
Figure 12. (Continued).
Data availability statement
The cycling data that support the findings of this study are openly available in Transport for London at https://cycling.data.tfl.gov.uk/.