Figures & data
Figure 1. The population density and traffic network in GBA.
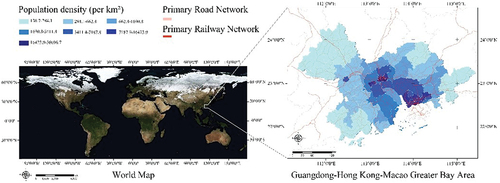
Figure 2. Daily population mobility and daily incidence of COVID-19 in GBA, 2020.
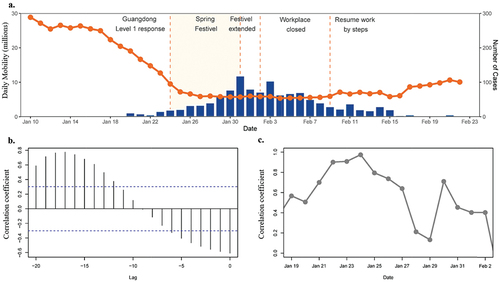
Figure 3. The correlation between daily population mobility and daily incidence of COVID-19 with different time lags.
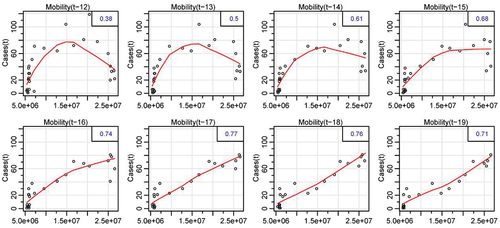
Figure 4. Mobility of 2020 and daily incidence of COVID-19 in nine cities of GBA (mobility volume of a specific city is calculated by the sum of intra-city travels, outflow travels between this city to other GBA cities, and inflow travels between other GBA cities to this city).
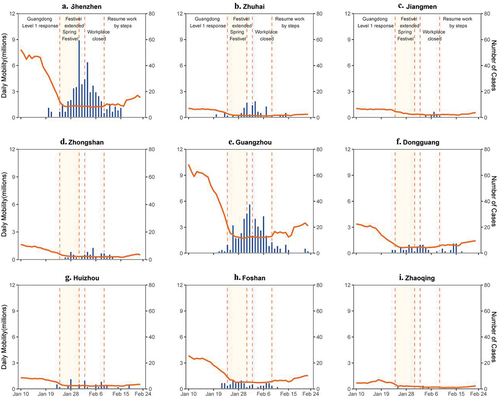
Table 1. Major mobility interventions in different pandemic stages in GBA.
Figure 5. Daily mobility of 2020 after Guangdong level 1 response compared with 2019 in nine cities of GBA.
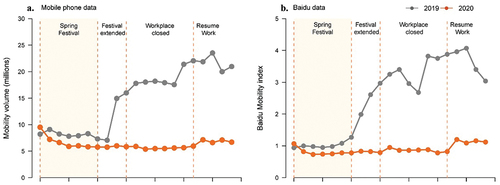
Figure 6. Mobility changes in travel radius after Guangdong level 1 response in 2020 compared with mobility in 2019.
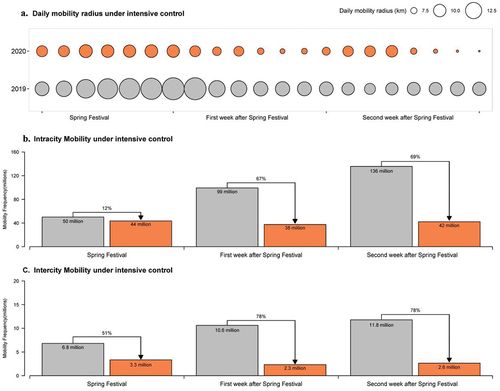
Figure 7. Daily population mobility changes by sex based on the mobile phone position data after Guangdong level 1 response for males in 2020 compared with the same lunar period of 2019.
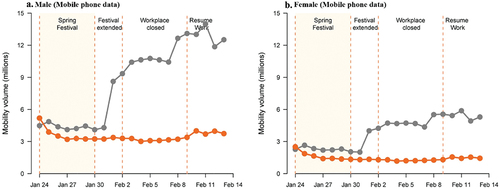
Figure 8. Change of mobility in 2020 compared with 2019 by age groups.
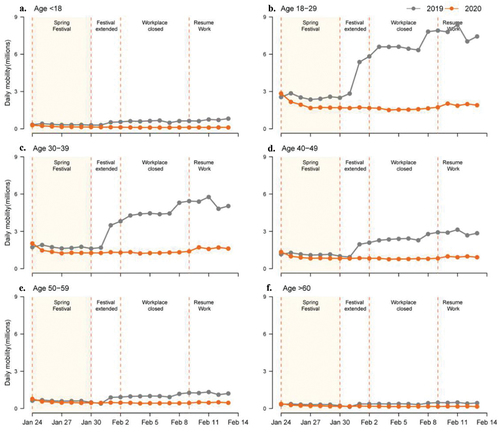
Figure 9. Mobility changes for inferred travel purposes.
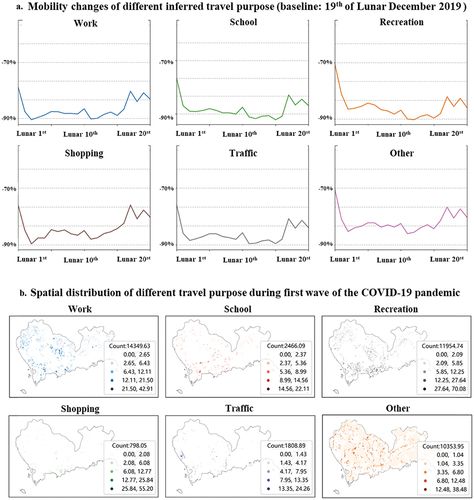
Figure A1. Data and data processing flow.
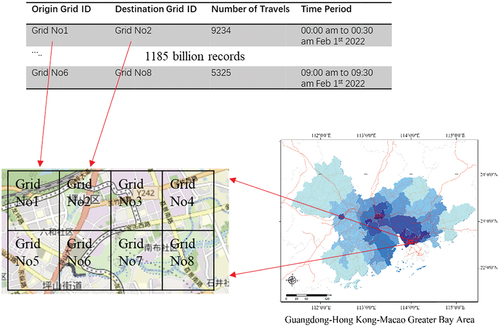
Figure A2. The data format of aggregated mobility data.