
Figures & data
Figure 1. Common frameworks for HSIs processing.
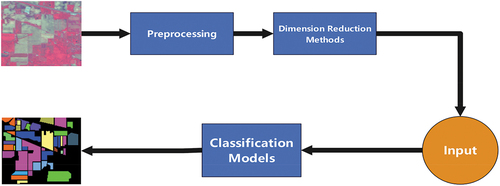
Figure 2. The number of recently published studies in the field of LULC using HSIs.
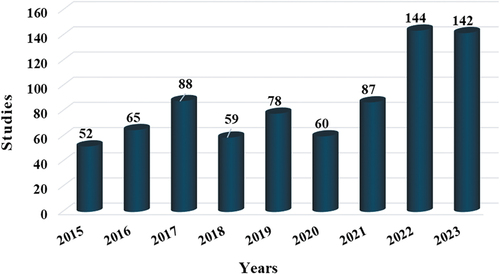
Table 1. Relevant information on the review of land cover/land use hyperspectral image classification in recent years.
Figure 3. Review directory.
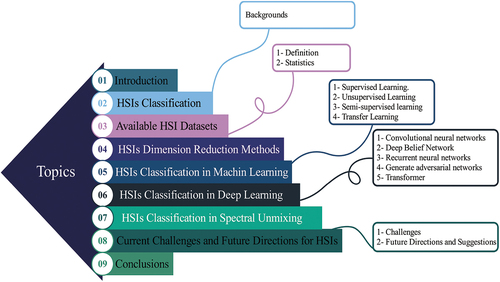
Table 2. Specific introduction to literature related to hyperspectral image classification.
Figure 4. Pseudo-color visualization of all hyperspectral datasets.
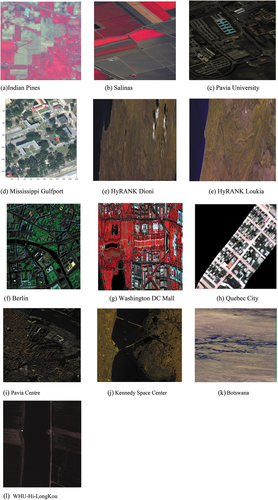
Table 3. The HSI datasets description and their sources.
Table 4. Examples of dimensionality reduction literature.
Table 5. Examples of supervised learning literature.
Table 6. Examples of unsupervised learning literature.
Table 7. Examples of semi-supervised learning literature.
Table 8. Examples of transfer learning literature.
Figure 5. Structure diagram of traditional convolutional neural networks.
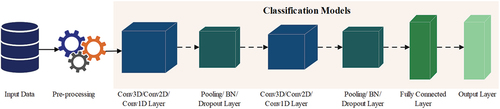
Table 9. Examples of CNNs literature.
Figure 6. Structure diagram of a deep belief network, where H refers to a hidden layer, and V to a visible layer.
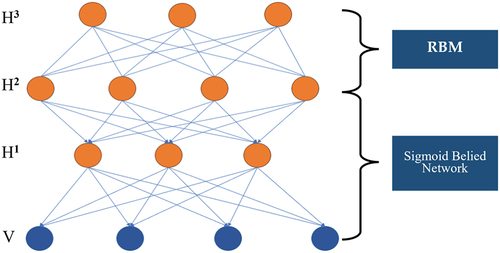
Table 10. Information related to DBN literature.
Figure 7. Structure diagram of the recurrent neural network, where X refers to the input, h(t) refers to a hidden state at time t, and L refers to the output. U, V, and W refer to the weights.
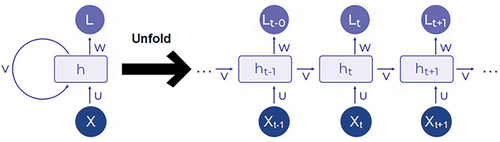
Table 11. Examples of RNN literature.
Figure 8. Structure diagram of GAN.
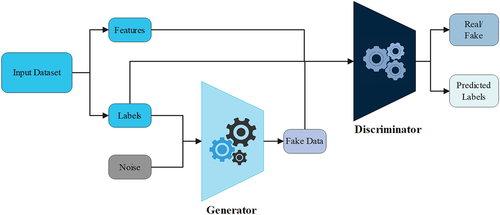
Table 12. Examples of GAN literature.
Figure 9. Structure diagram of transformer.
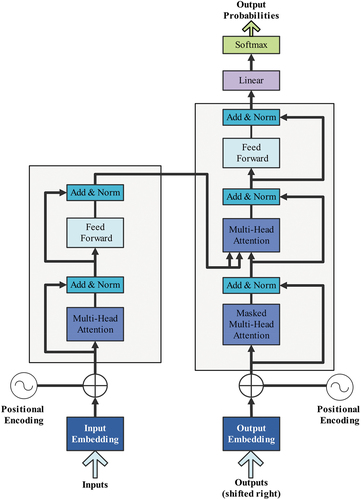
Table 13. Examples of transformer literature.
Data availability statement
This is a review paper. No data was used in this study.