
Figures & data
Figure 1. Number of registered OSM users (https://wiki.openstreetmap.org/wiki/Stats).
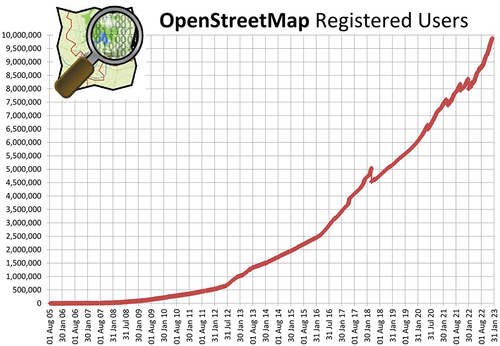
Figure 2. Technical framework of this study.
Table 1. OSM data quality evaluation index system.
Figure 3. Position accuracy evaluation.
Figure 4. (a) The vector boundary of the study area, (b) OSM road network data in 2020, (c) OSM POI data in 2020.
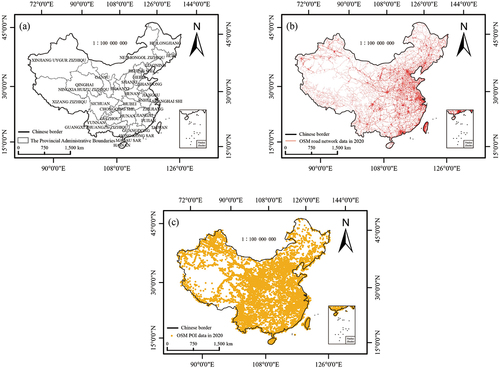
Table 2. Corresponding relationships between OSM data and the reference data.
Table 3. The weights of OSM data quality indicators at different scales.
Figure 5. The weights of quality dimensions at different spatial scales.
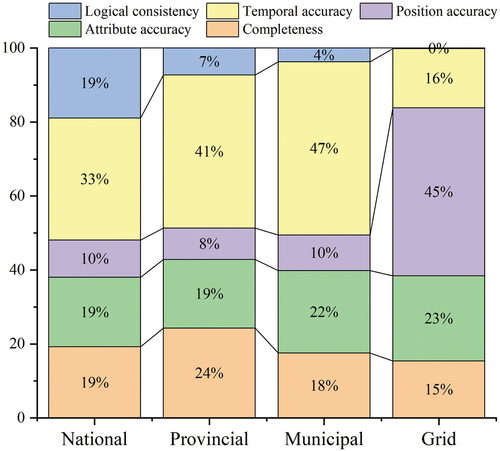
Figure 6. OSM data quality trends at the national scale in China from 2014 to 2020.
Table 4. OSM data quality at the national scale in China from 2014 to 2020.
Figure 7. OSM data quality at the provincial scale in China from 2014 to 2020.
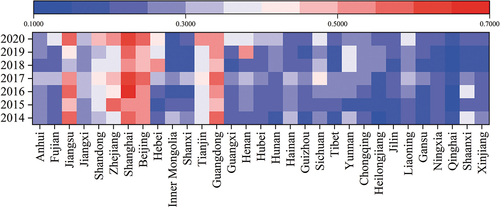
Figure 8. OSM data quality at the municipal scale (taking provincial capitals as an example) in China from 2014 to 2020.
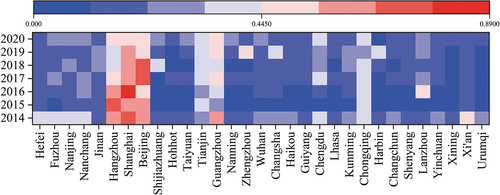
Figure 9. Spatial distribution of OSM data quality at the provincial scale in China in (a) 2014, (b) 2015, (c) 2016, (d) 2017, (e) 2018, (f) 2019, and (g) 2020.
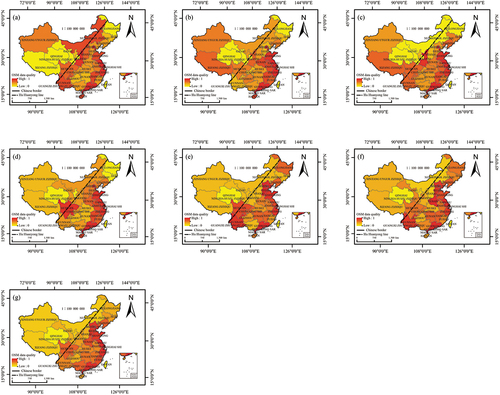
Figure 10. Spatial distribution of OSM data quality at the municipal scale in China in (a) 2014, (b) 2015, (c) 2016, (d) 2017, (e) 2018, (f) 2019, and (g) 2020.
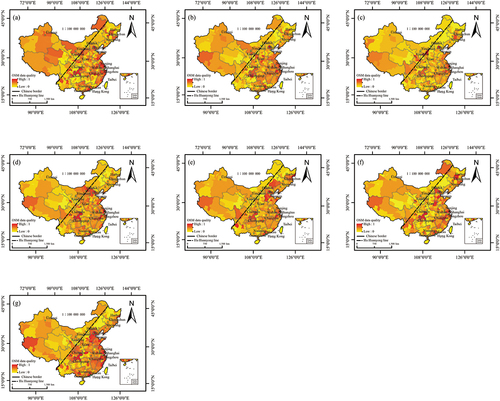
Figure 11. OSM data quality in six geographical regions in China at the (a) provincial scale and (b) municipal scale.
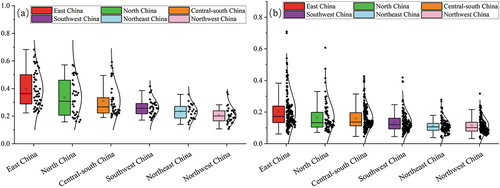
Figure 12. Spatial distribution of OSM data quality at the grid scale in China in (a) 2014, (b) 2015, (c) 2016, (d) 2017, (e) 2018, (f) 2019, and (g) 2020. (h) OSM data quality in six geographical regions in China at the grid scale.
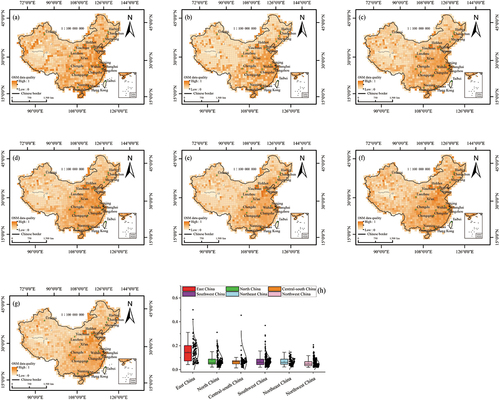
Table 5. Global spatial autocorrelation results based on Moran’s I values from 2014 to 2020.
Figure 13. Local spatial autocorrelation distribution of OSM data quality at the provincial scale in (a) 2014, (b) 2015, (c) 2016, (d) 2017, (e) 2018, (f) 2019, and (g) 2020.
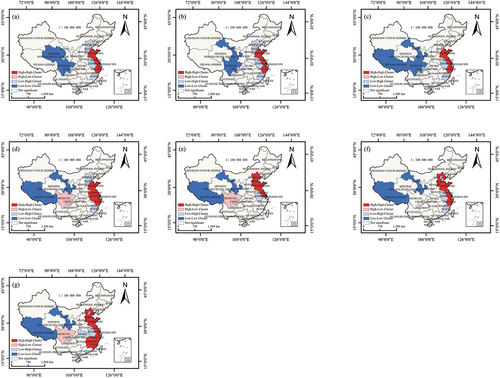
Figure 14. Local spatial autocorrelation distribution of OSM data quality at the municipal scale in (a) 2014, (b) 2015, (c) 2016, (d) 2017, (e) 2018, (f) 2019, and (g) 2020.
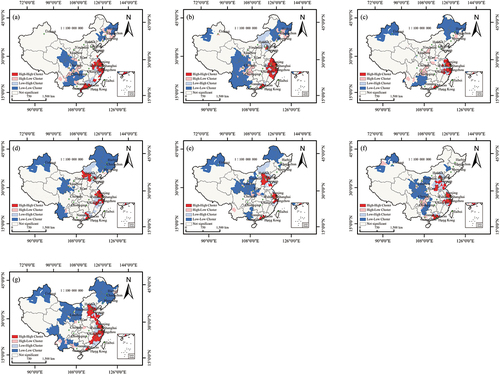
Figure 15. Local spatial autocorrelation distribution of OSM data quality at the grid scale in (a) 2014, (b) 2015, (c) 2016, (d) 2017, (e) 2018, (f) 2019, and (g) 2020.
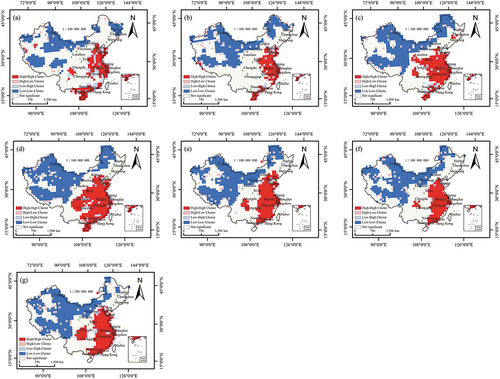
Table 6. Statistics of local spatial autocorrelation for different spatial agglomeration types and scales from 2014 to 2020.
Table 7. Collinearity statistical results.
Table 8. OSM data quality and GDP modeling results at the provincial and municipal scales in China.
Figure 16. Local R2 spatial distribution of the GTWR model at the (a) provincial scale and (b) municipal scale.
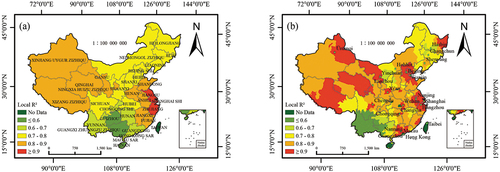
Figure 17. Spatial distribution of regression coefficients for the GTWR model at the municipal scale.
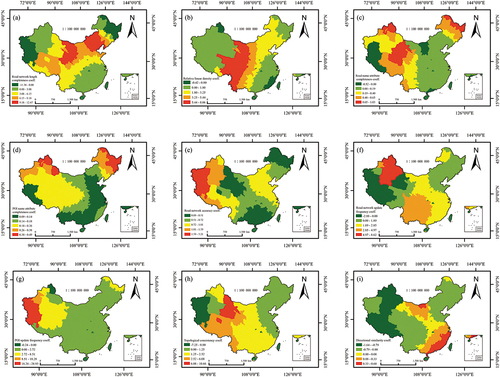
Table 9. Comparison of the accuracy of the GDP simulation results of different machine learning models.
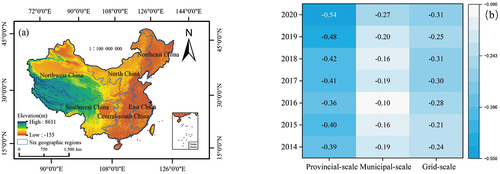
Figure 18. (a) DEM of six geographical regions in China. (b) Correlation between OSM data quality and DEM at different spatial scales.
Data availability statement
The OpenStreetMap data were sourced from the official website of OSM (https://www.openstreetmap.org/). Reference road vector data were obtained from Baidu Maps (https://map.baidu.com/). The vector boundary of the research area was obtained from the Chinese Resource and Environment Science and Data Center (https://www.resdc.cn/). The actual road mileage data, Provincial and municipal GDP were obtained from the National Bureau of Statistics of China (http://www.stats.gov.cn/) and the China City Statistical Yearbook (https://www.yearbookchina.com/).