
Figures & data
Figure 1. (a) Location of the study area (b) spatial distribution of Sentinel-2 images and sample plots in the study area (c) UAV laser cloud images of study area sites (d) Masson pine age survey.
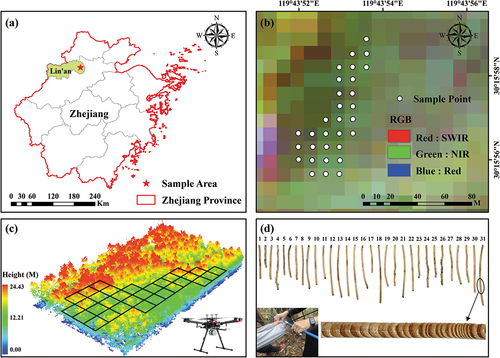
Table 1. LiDAR-extracted feature variables.
Table 2. Sentinel-2 extracted feature variables.
Table 3. Optimized model parameters.
Figure 2. Flowchart of the steps used in our study.
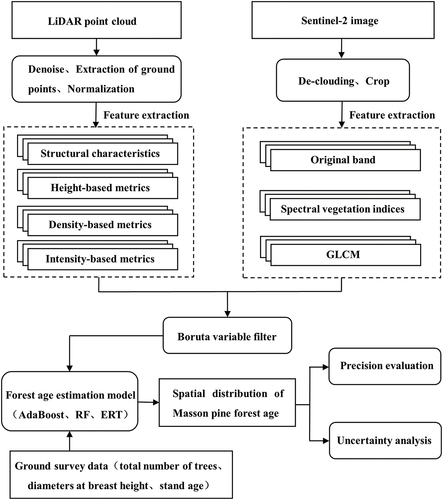
Figure 3. Results of feature variable screening based on the Boruta algorithm.
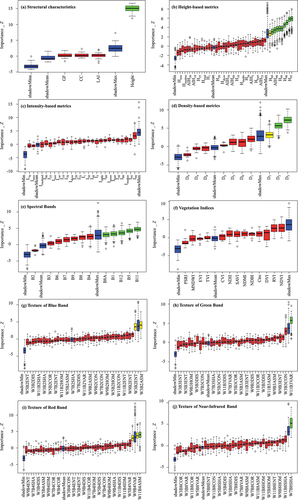
Table 4. Feature variables filtered based on the Boruta algorithm.
Figure 4. Comparison of the accuracy of the forest age estimation models.
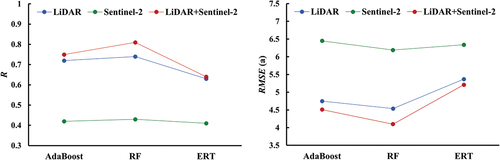
Figure 5. Forest age estimation results (a) accuracy evaluation of forest age model based on single LiDAR data (b) accuracy evaluation of forest age model based on single Sentinel-2 data (c) Accuracy evaluation of forest age model with LiDAR combined with Sentinel-2.
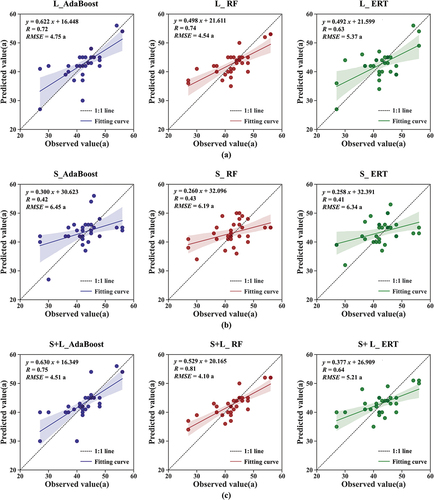
Table 5. Distribution of the absolute values of prediction errors.
Figure 6. Age distribution of Masson pine based on LiDAR combined with Sentinel-2 data.
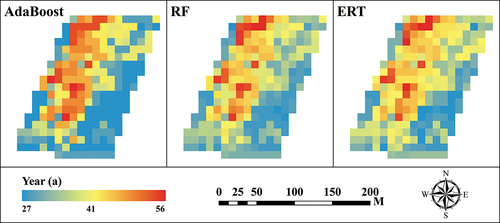
Figure 7. Sentinel-2 spectral curves and normalized LiDAR point cloud heights for trees of different ages.
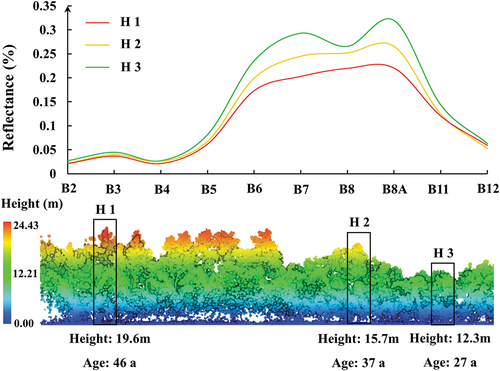
Figure 8. (a) Importance ranking of modeling parameters and (b) correlation between the top 6 variables in terms of importance ranking and stand age.
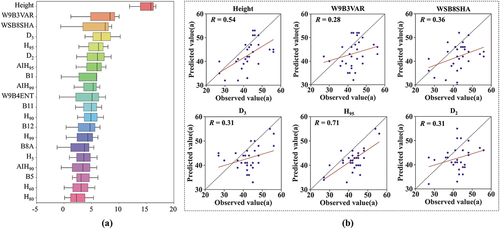
Table 6. Visible vegetation index.
Figure 9. RF forest age model estimation results (a) accuracy evaluation of forest age model based on single UAV imagery data (b) accuracy evaluation of forest age model with LiDAR combined with UAV imagery.
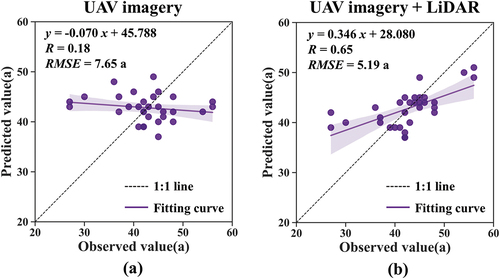
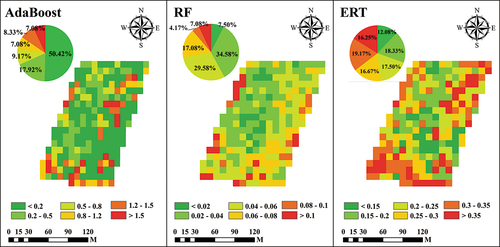
Figure 10. Uncertainty analysis of forest age prediction.
Data availability statement
The Sentinel-2 dataset used in this study is publicly available for download from The Copernicus Open Access Hub (https://scihub.copernicus.eu/).The other data that support the findings of this study are available from the corresponding author, [Huaqiang Du, E-mail: [email protected]], upon reasonable request.