
Figures & data
Figure 1. Study area and sample collection area (a), sugarcane in elongation stage (b), and sample sites in sample collection area (c).
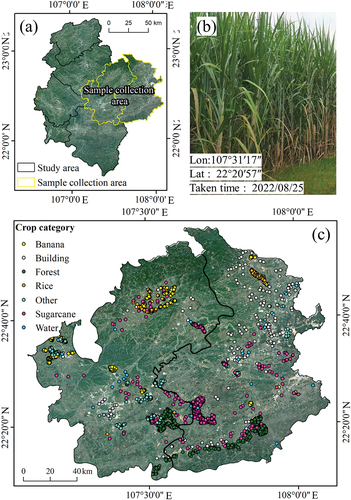
Table 1. Growth stages of main crops in Chongzuo City.
Figure 2. Radiometric calibration and error compensation proposed in this study.
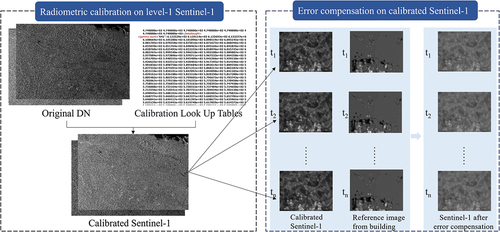
Table 2. Sample area and sample size in this experiment.
Figure 3. Descriptive statistics of the ground truth of sugarcane height.
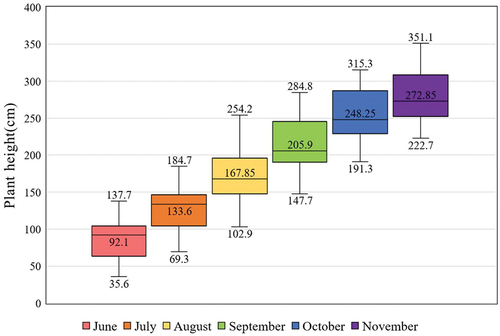
Figure 4. Flowchart of technical route.
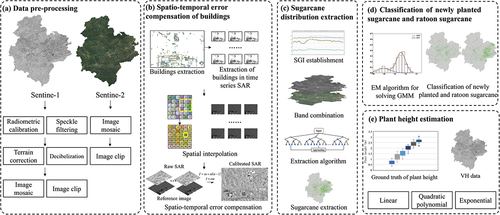
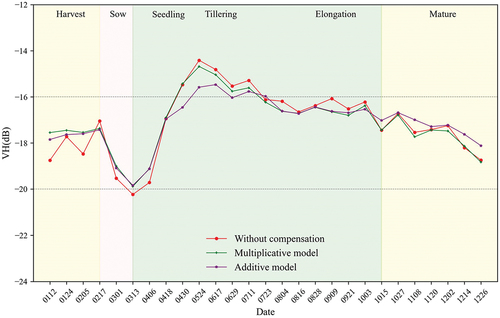
Figure 5. Time sequence diagram of mean values of VH in 6 objects in 2022 (the shaded areas refer to the standard deviation calculated from the sample points).
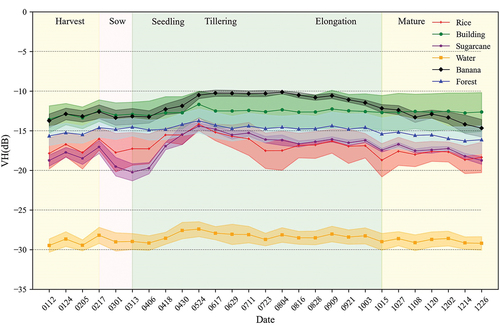
Table 3. Evaluation of correlation of backscatter coefficient among six objects.
Figure 6. Accuracy evaluation of sugarcane extraction by different calibration methods.
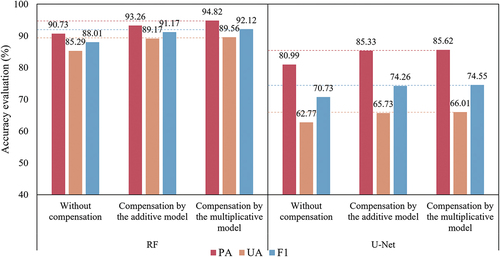
Table 4. Accuracy evaluation of sugarcane extraction with different data combinations.
Figure 7. Extraction results of sugarcane in Chongzuo city.
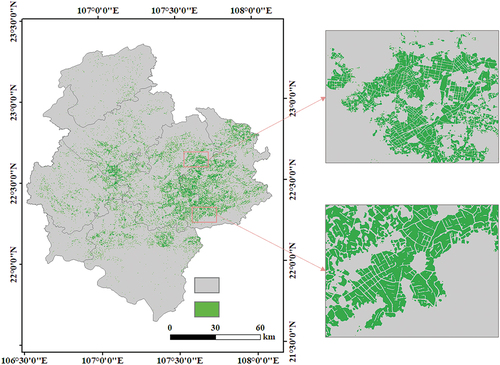
Figure 8. Normalized (AIC + BIC) metric of GMM fitting for sugarcane area in 2022.
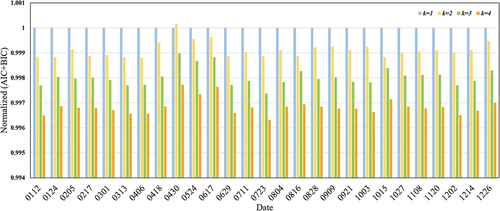
Figure 9. GMM distribution fitting diagram in the seedling stage (a), AIC+BIC metric chart in the seedling stage (b), GMM distribution fitting diagram in the elongation stage (c), and AIC+BIC metric chart in the elongation stage (d).
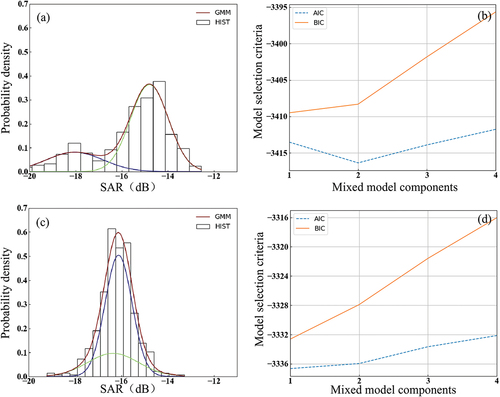
Table 5. Accuracy evaluation of extraction of newly planted sugarcane and ratoon sugarcane in Jiangzhou district.
Figure 10. Estimation results of sugarcane height: without compensation (a), compensation by the additive model (b), compensation by the multiplicative model (c), and estimation results of sugarcane height (d).
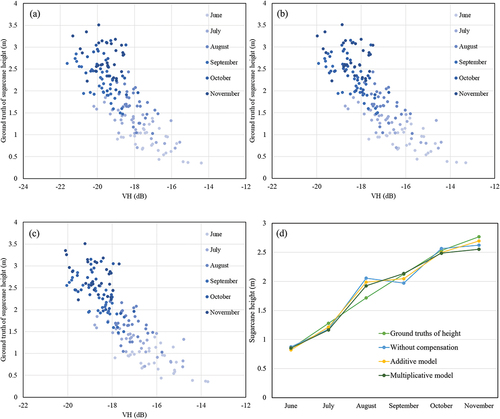
Table 6. Accuracy evaluation of sugarcane extraction with different data combinations.
Figure 11. Accuracy evaluation of sugarcane extraction under different feature combinations.
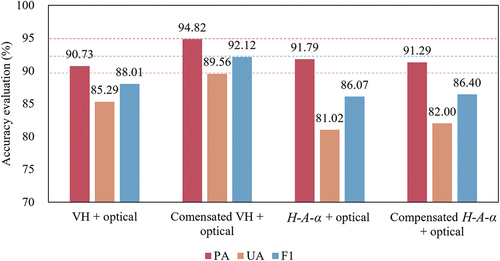
Table 7. Evaluation of additive and multiplicative compensation models.
Figure 12. Sugarcane region comparison before and after calibration of time series SAR data.
Data availability statement
Upon reasonable request, the corresponding author will provide access to the data used to support the study’s findings.