
Figures & data
Figure 1. The flowchart of this study.
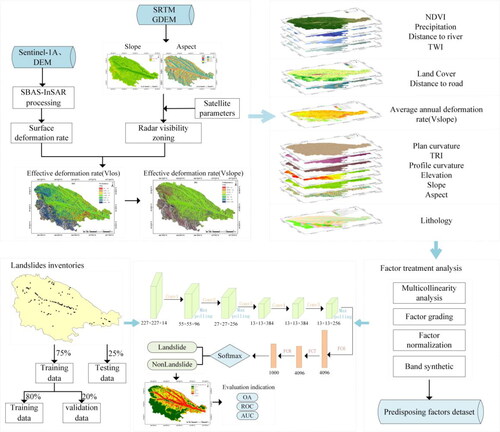
Figure 2. Location of the study area.
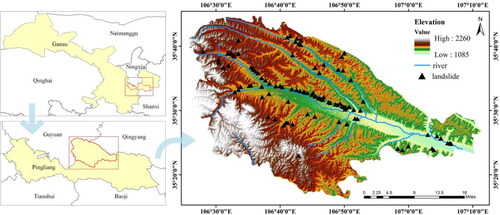
Figure 3. Landslide sites in Kongtong District available online. (a) & (b) Baishui Town, July 11 2018 (https://www.sohu.com/a/241243234_681138); (c) Kongtong Town, July 27 2018 (https://mp.weixin.qq.com/s/rNpuW3930kZevN6LUDUZoA).
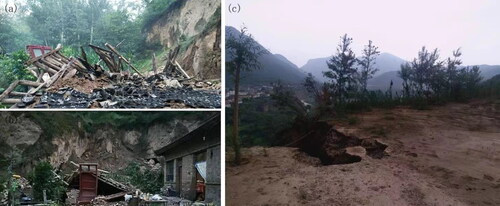
Figure 4. Distribution of labeled data.
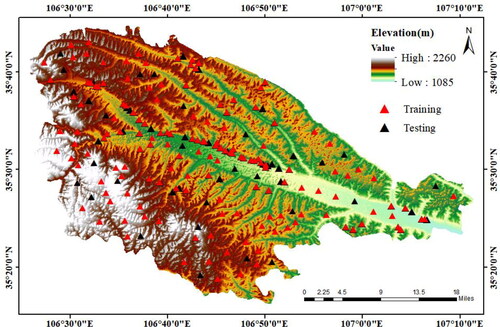
Table 1. Basic parameters of the Sentinel-1A images.
Figure 5. Flow chart of surface deformation rate acquisition by SBAS-InSAR.
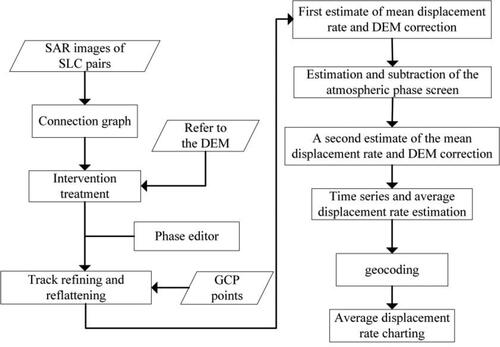
Figure 6. The ‘Dynamic and Static’ + ‘Internal and External’ factors in landslide hazard analysis system.
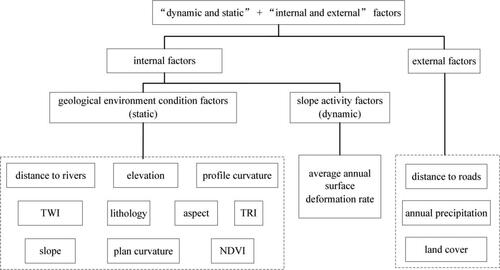
Figure 7. MCE-CNN network architecture.
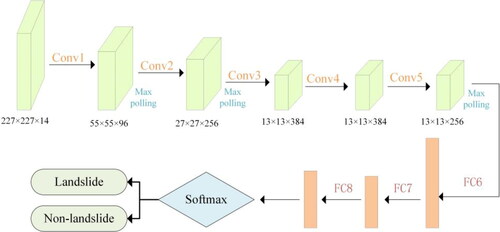
Figure 8. Average annual deformation rate in LOS direction, ranging from −81 to 101 mm/y.
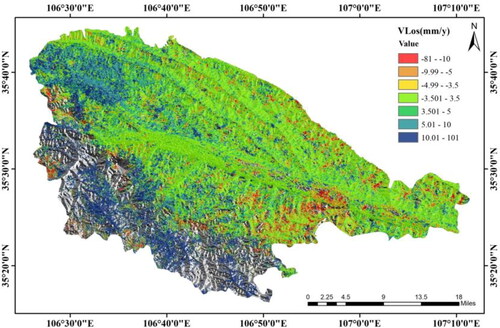
Figure 9. Average annual deformation rate in slope direction.
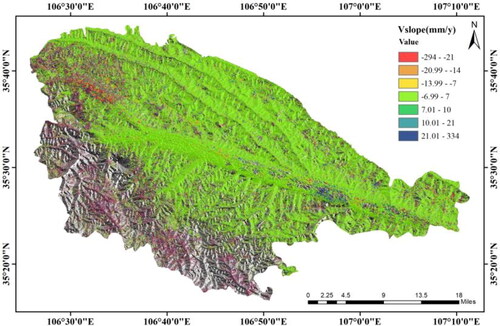
Figure 10. Landslide evaluation factors: (a) Elevation; (b) Aspect; (c) Slope; (d) Plan curvature; (e) Profile curvature; (f) TRI; (g) Lithology; (h) Distance to roads; (i) TWI; (j) Annual precipitation; (k) NDVI; (l) Land cover; (m) Distance to rivers; (n) Average annual deformation rate in slope direction.
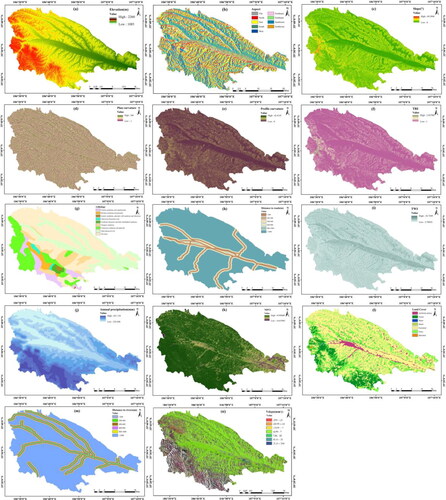
Table 2. Sources of factors.
Figure 11. Results: (a) MCE-CNN; (b) SBAS-MCE-CNN; (c) SVM; (d) SBAS-SVM; (e) RF; (f) SBAS-RF.
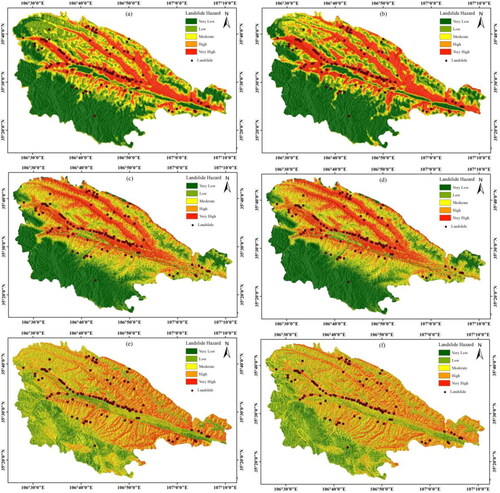
Table 3. Multi-collinearity diagnostics for the variables used in this study.
Figure 12. Comparison of ROC curves of different methods.
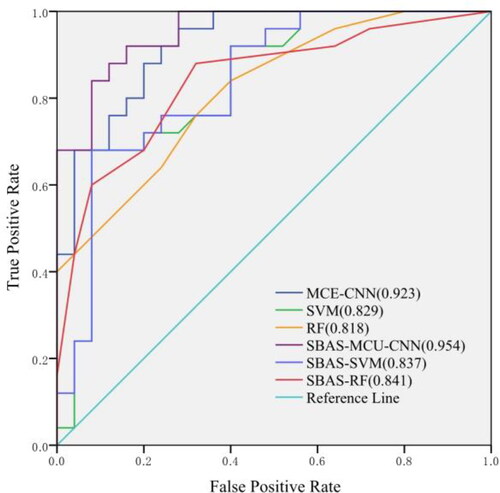
Figure 13. Detailed comparison of hazard analysis results.
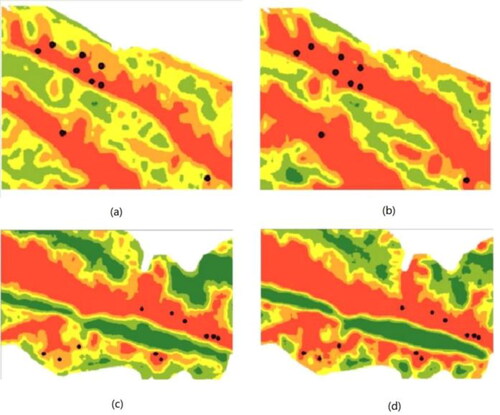
Table 4. Comparison of OA values between different methods.
Table 5. Landslide zonal statistics.
Code availability
The code used during the current study are available from the corresponding author on reasonable request.