
Figures & data
Figure 1. Location of the study area within a) Africa b) Tanzania, and c) Dar es Salaam Metropolitan City.
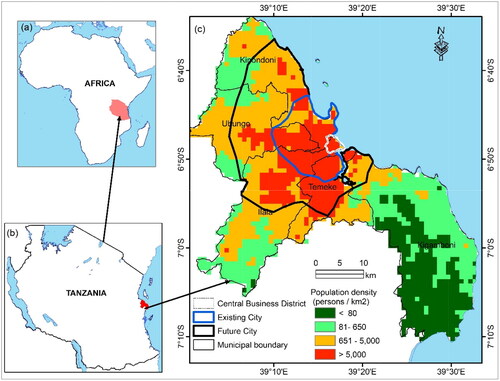
Table 1. Details of Landsat satellite imagery.
Table 2. Derivation of spectral index explanatory variables from Landsat data.
Figure 2. Concept of determination for built-up pixels in the urban high-density plot.
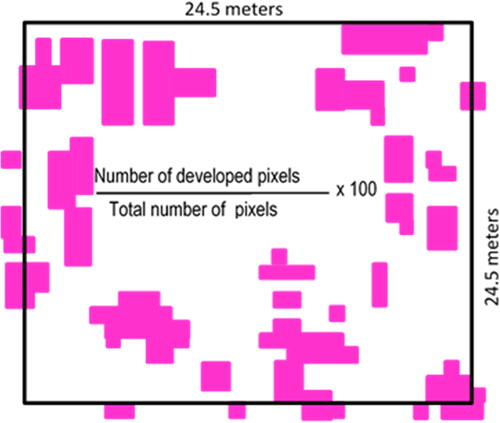
Figure 3. Spatiotemporal distribution of LST for (a) 1995, (b) 2009, and (c) 2017.
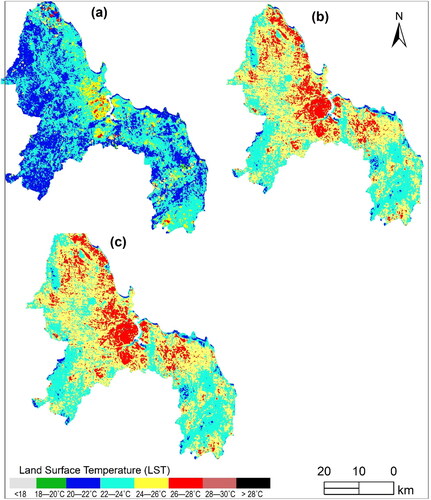
Table 3. OLS model regression results.
Table 4. Regression coefficients between LST and driving factors.
Table 5. Results of modelling biophysical variables and LST by the GWR model.
Table 6. Global Moran’s I spatial autocorrelation summary for 1995, 2009, and 2017.
Figure 4. Geographical variables affecting LST in the study area: a) NDBI, b) SAVI, and c) NDBaI.
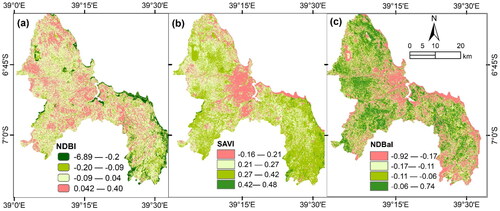
Figure 5. Distribution of residuals using GWR in the study area for a) 1995, b) 2009, and c) 2017.
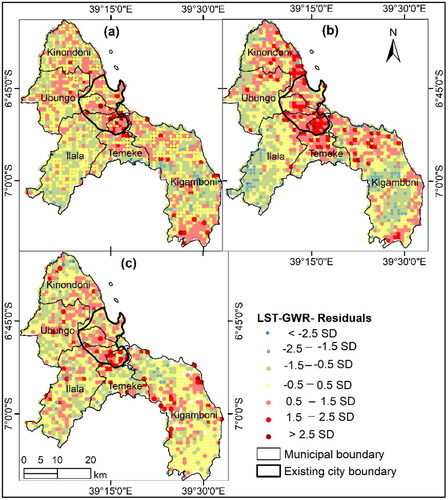
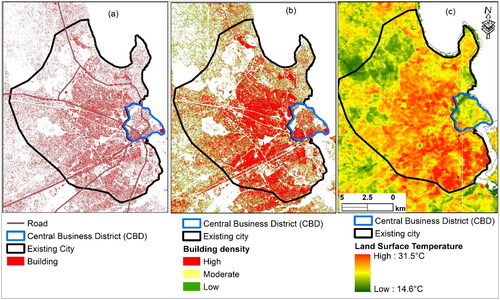
Figure 6. Relationships between building density and LSTs in Dar es Salaam central business district and existing city: a) building layer, b) building density pixel classification, and c) LST. Building layer was modified from Resilience Academy - Dar es Salaam buildings (https://resilienceacademy.ac.tz).
Data availability statement
The data that support the findings of this study are available from the corresponding author, [O.S], upon reasonable request.