Figures & data
Figure 1. Study area and location of sample areas from landslides. Coordinate system: UTM, Zone 22S (WGS-84).
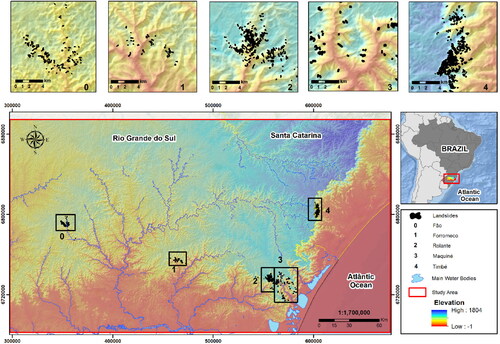
Table 1. Location of landslide sample areas in Serra Geral, southern Brazil.
Figure 2. Example of converting polygons to point features to define the sample set of landslides occurrence.
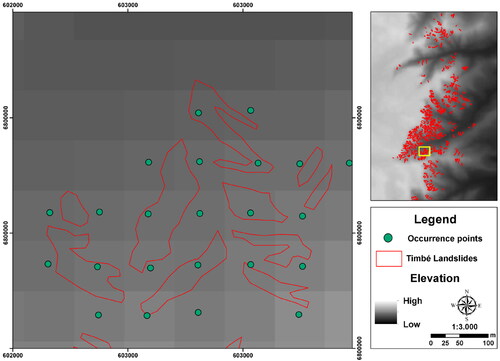
Figure 3. Example of buffer distances used for non-occurrence sampling.
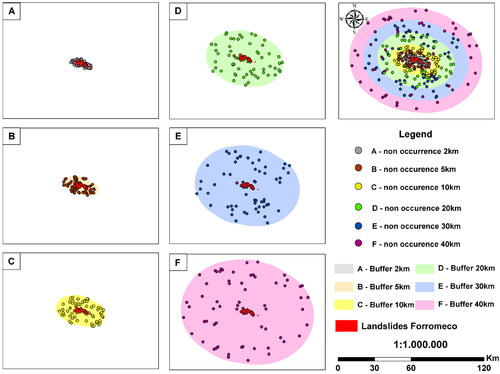
Figure 4. Terrain morphometric attributes used as input in the modeling.
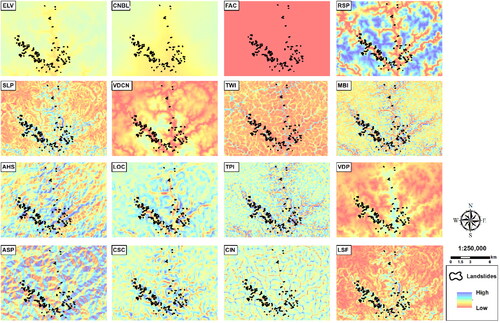
Table 2. Statistical values of terrain morphometric attributes.
Table 3. Summary of landslides samples: mean and maximum areas of landslide polygons and the mean values of the some of the most important morphometric attributes.
Table 4. Attributes’ mean values in each of the best models for the occurrence samples.
Table 5. Linear correlation coefficients for the independent variables with the model’s dependent variable (occurrence or non-occurrence of landslides) for each buffer. The values in red indicate the input variables that were excluded (in each dataset), due to the non-significant linear correlation.
Table 6. Performance metrics summary: Full Model, all buffers. Legend: TV = true positive; FP = false positive; FN = false negative; TN = true negative.
Table 7. Performance metrics summary: only the best Single Model for each sample area. Legend: TV = true positive; FP = false positive; FN = false negative; TN = true negative.
Table 8. Area under the ROC curve (Accuracy), considering test samples: Single and Full Models. In red the best models of the Single and Full version.
Table 9. Area highly susceptible to landslides in each of the best models.
Figure 5. Comparison between models that used total samples (Full Model).
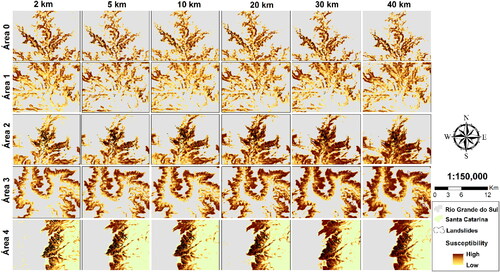
Figure 6. Comparison of landslides areas between the best models: A) best model with separated samples, Single Model; B) best model with jointed samples, Full Model.
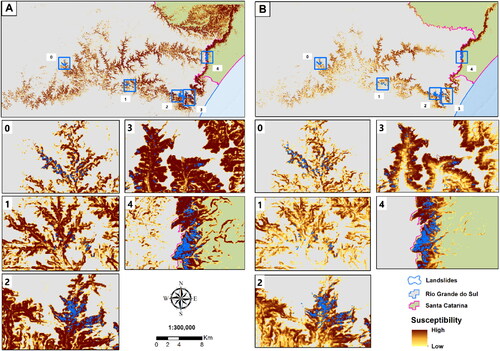
Figure 7. Subtraction between the best version of Full and Single Model.
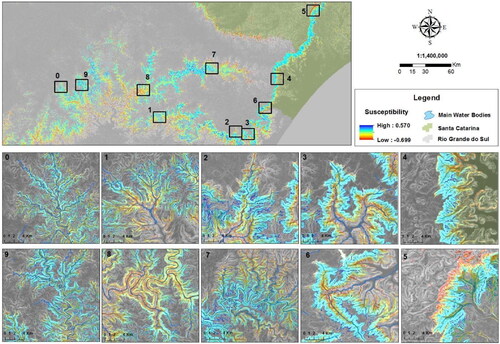
Table 10. Relative Contribution Index (%) of each independent variable of the models.
Figure 8. Graphs showing the relation between the landslide susceptibility index from the best models and the main morphometric attributes.
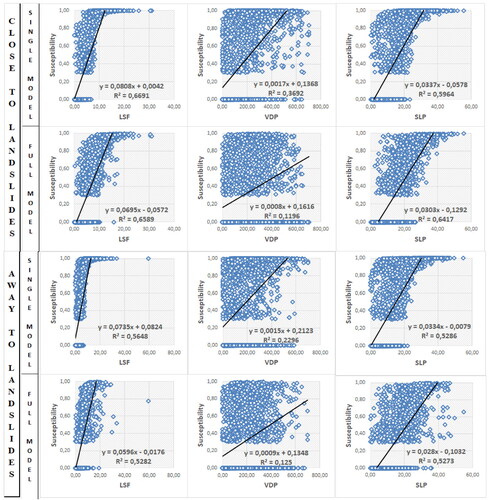
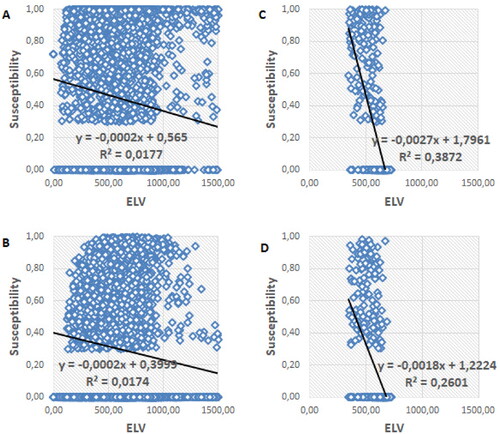
Figure 9. Relationship between susceptibility index and elevation in the best models; A) Use of all samples for the single model; B) Use of all samples for the full model; C) Use of samples from area 0 for the single model; D) Use of samples from area 0 for the full model.