1,308
Views
9
CrossRef citations to date
0
Altmetric
Research Article

Essential insights into decision mechanism of landslide susceptibility mapping based on different machine learning models

, , ORCID Icon, ORCID Icon, , , & show all
Pages 1-29 | Received 27 Jun 2022, Accepted 07 Nov 2022, Published online: 17 Nov 2022

Figures & data

Figure 1. Location and geological map of the study area.

Figure 1. Location and geological map of the study area.

Figure 2. Distribution and on-site investigation of landslides in the study area.

Figure 2. Distribution and on-site investigation of landslides in the study area.

Table 1. Data and data sources.

Figure 3. Flowchart of the study.

Figure 3. Flowchart of the study.

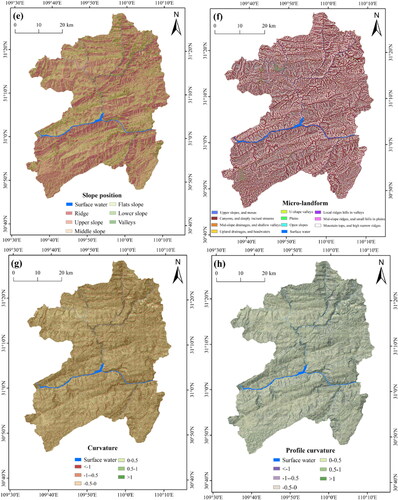
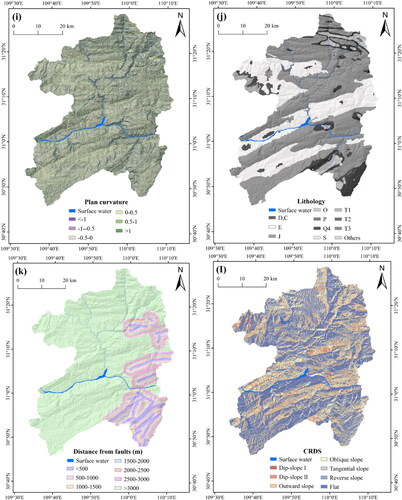
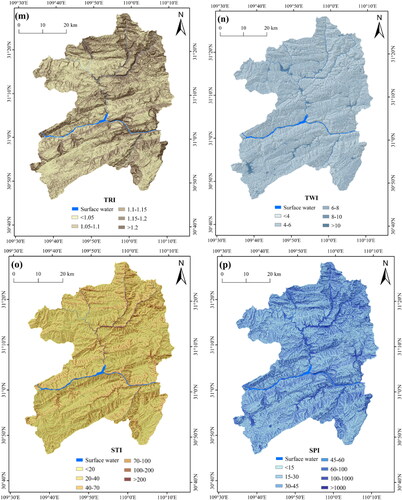
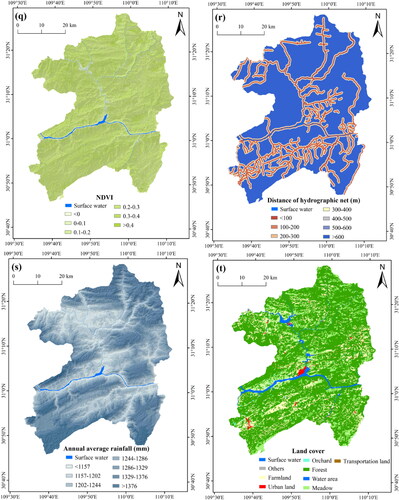
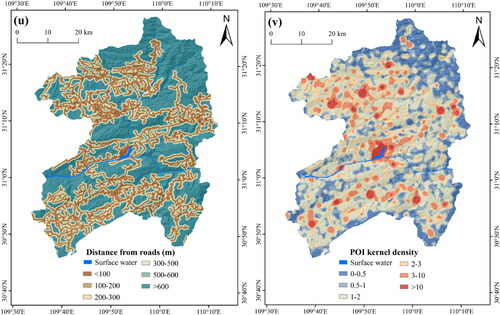
Table 2. Description of landslides conditioning factors.

Table 3. Classification of landslide-conditioning factors.

Figure 5. BP neural network model structure.

Figure 5. BP neural network model structure.

Figure 6. The schematic diagram of the random forest (RF) algorithm.

Figure 6. The schematic diagram of the random forest (RF) algorithm.

Figure 7. Landslide susceptibility mappings: (a) ANN model; (b) RF model.

Figure 7. Landslide susceptibility mappings: (a) ANN model; (b) RF model.

Table 4. The accuracy of 10-fold cross-validation.

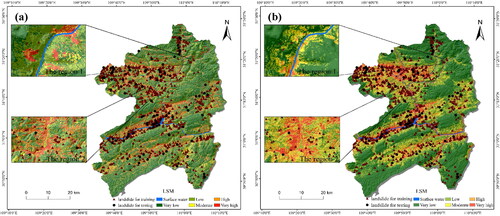
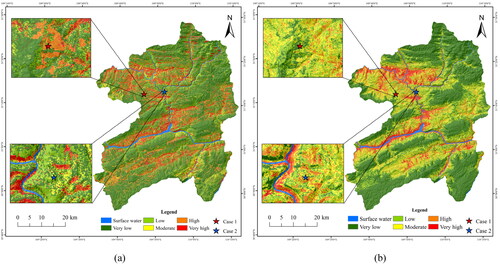
Table 5. Statistics of the susceptibility classes.

Figure 8. ROC curve of the ANN and RF models: (a) ANN model; (b) RF model.

Figure 8. ROC curve of the ANN and RF models: (a) ANN model; (b) RF model.

Table 6. Confusion matrix of the ANN and RF models.

Figure 9. Factor importance ranking: (a) ANN; (b) RF.

Figure 9. Factor importance ranking: (a) ANN; (b) RF.

Figure 10. Selection of case units: (a) ANN; (b) RF.

Figure 10. Selection of case units: (a) ANN; (b) RF.

Figure 11. Waterfall plot of landslide case unit: (a) ANN; (b) RF.

Figure 11. Waterfall plot of landslide case unit: (a) ANN; (b) RF.

Figure 12. Waterfall plot of non-landslide case unit: (a) ANN; (b) RF.

Figure 12. Waterfall plot of non-landslide case unit: (a) ANN; (b) RF.

Figure 13. Summary plot of SHAP values: (a) ANN; (b) RF.

Figure 13. Summary plot of SHAP values: (a) ANN; (b) RF.

Data availability statement

The data presented in this study can be available on request from the corresponding author.