
Figures & data
Figure 1. Locational aspect of the experimental study area.
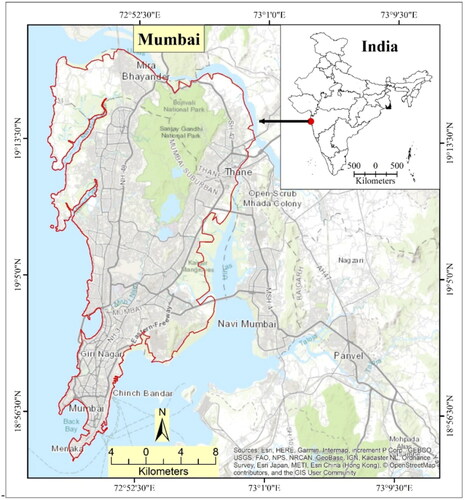
Table 1. Details of the Landsat satellite data used.
Figure 2. The schematic diagram of the process of wavelet-PCA for generating the high-resolution multispectral images.
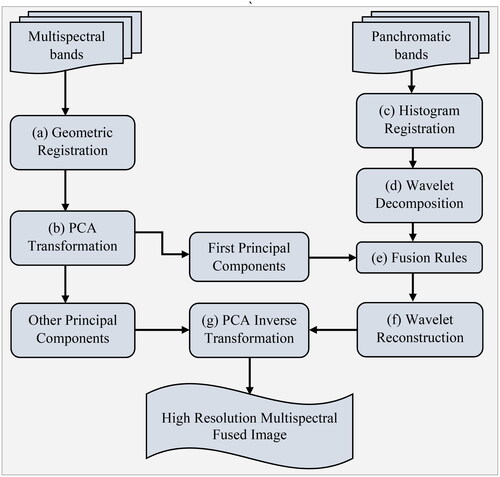
Figure 3. False color composite after fusion of (a) Landsat 8 OLI and (b) Landsat 9 OLI-2 data.
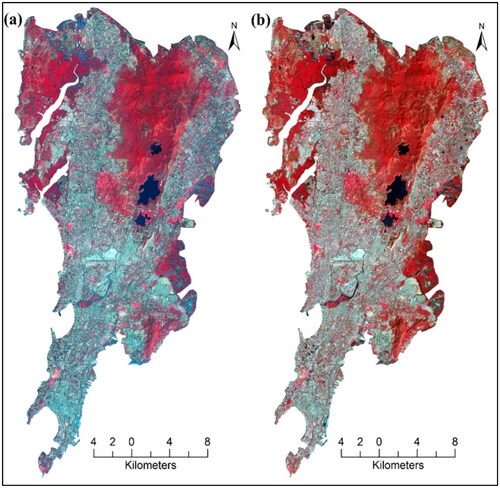
Figure 4. Methodological flow chart for the study.
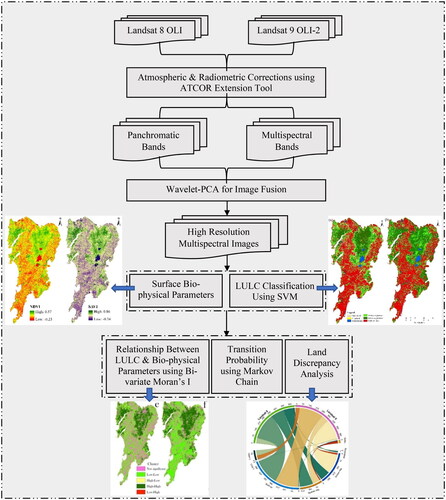
Figure 5. Classified LULC maps using multispectral bands of (a) Landsat 8 OLI and (b) Landsat 9 OLI-2.
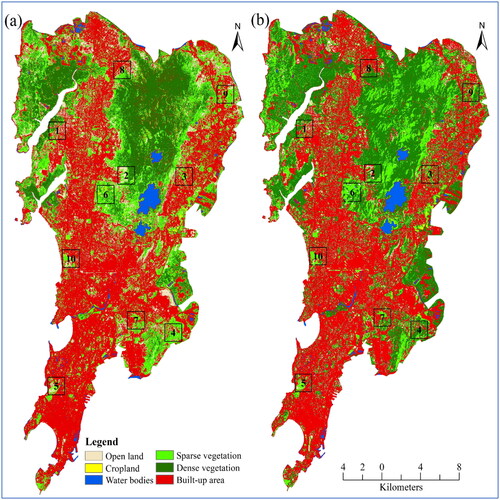
Figure 6. Comparison of the LULC classification with google earth.
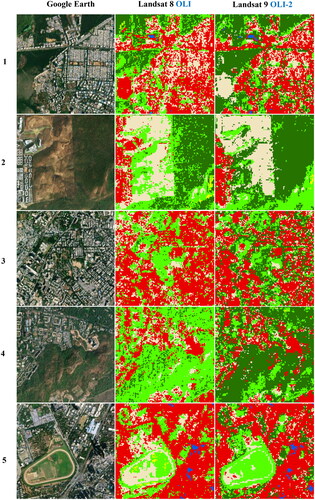
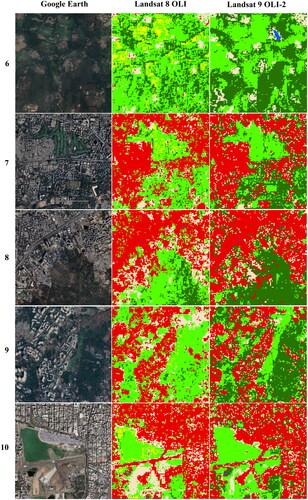
Figure 7. Land discrepancy analysis between Landsat 8 and 9 using Markovian transition matrix.
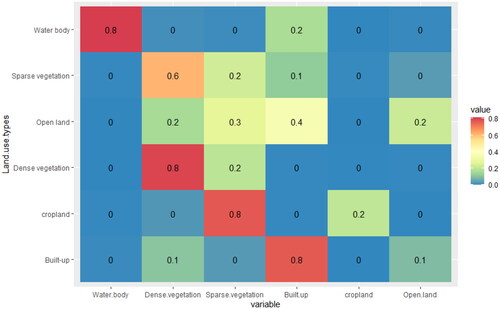
Figure 8. Visualization of spatial discrepancy of land detection between Landsat 8 and Landsat 9.
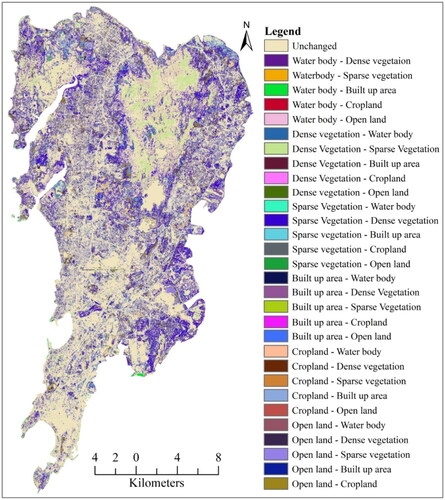
Figure 9. Quantification of land detection discrepancy between the LULC of Landsat 8 OLI and Landsat 9 OLI-2.
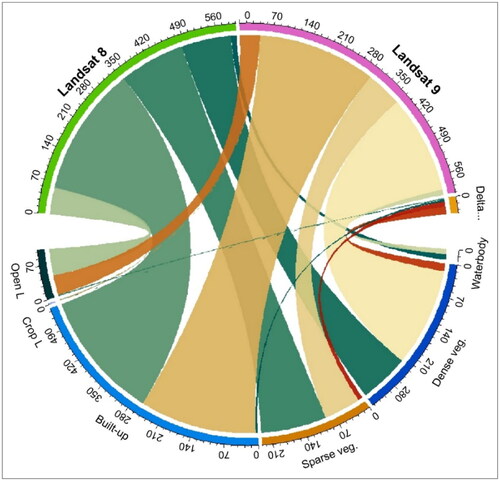
Figure 10. Surface biophysical parameters calculated from Landsat 8 OLI and Landsat 9 OLI-2 data sets.
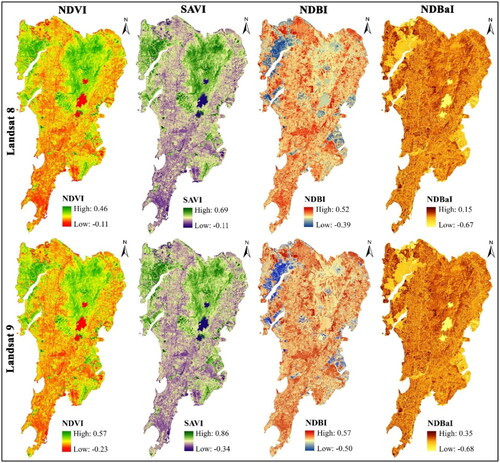
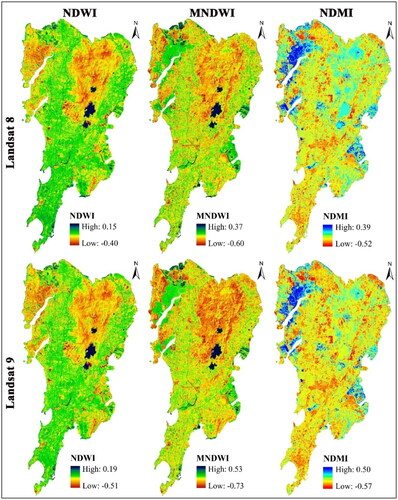
Table 2. Validation of LULC map of landsat OLI.
Table 3. Validation of LULC map of landsat OLI-2.
Figure 11. Significance analysis using bivariate local Moran’s I for (a) LULC-MNDWI, (b) LULC-NDVI, (c) LULC-SAVI, and (d) LULC-NDBI, and cluster-dispersion analysis for I LULC-MNDWI, (f) LULC-NDVI, (g) LULC-SAVI, and (h) LULC-NDBI for Landsat 8.
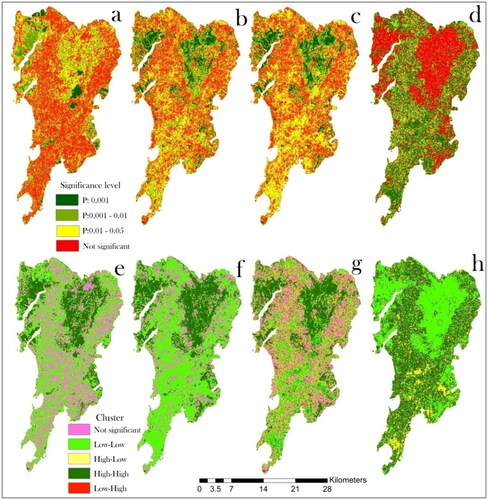
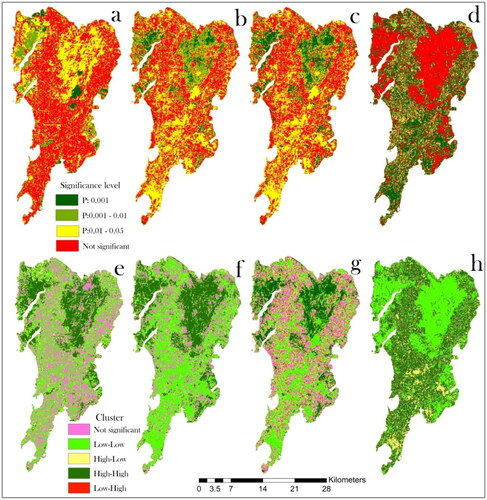
Figure 12. Significance analysis using bivariate local Moran’s I for (a) LULC-MNDWI, (b) LULC-NDVI, (c) LULC-SAVI, and (d) LULC-NDBI, and cluster-dispersion analysis for I LULC-MNDWI, (f) LULC-NDVI, (g) LULC-SAVI, and (h) LULC-NDBI for Landsat 9.
Data availability statement
The data will be available upon reasonable request through corresponding authors.