
Figures & data
Figure 1. Network framework diagram.
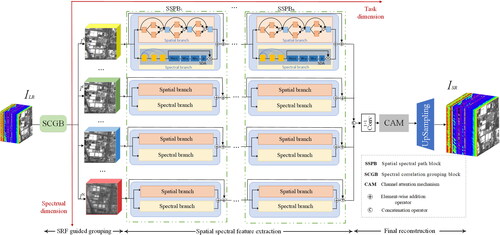
Figure 2. Spectral response function guide block.
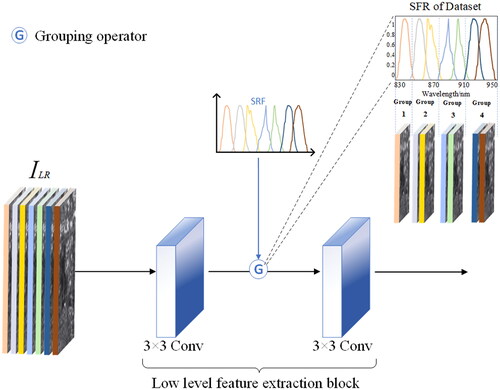
Figure 3. Spatial-spectral dual pathway module structure.
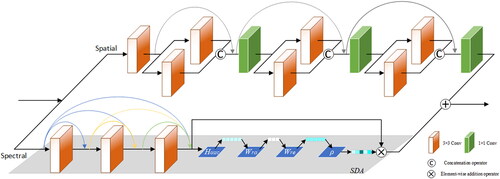
Figure 4. Partial data presentation for each dataset. (a) Qingdao, Shandong Province and (b) Tianjin, China.
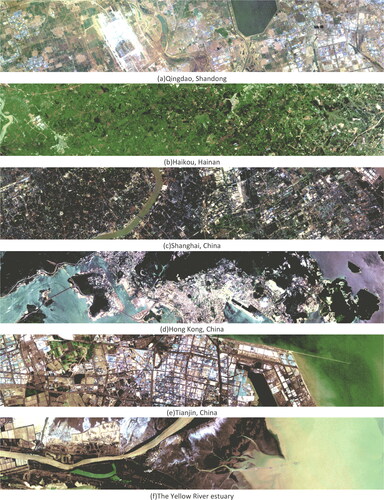
Table 1. Comparison results of different numbers of SSPBs in the Qingdao dataset in Shandong.
Table 2. Quantitative comparison of different methods for large building datasets.
Figure 5. Visualization results of the large building dataset. (a) Qingdao, Shandong Province and (b) Tianjin, China.
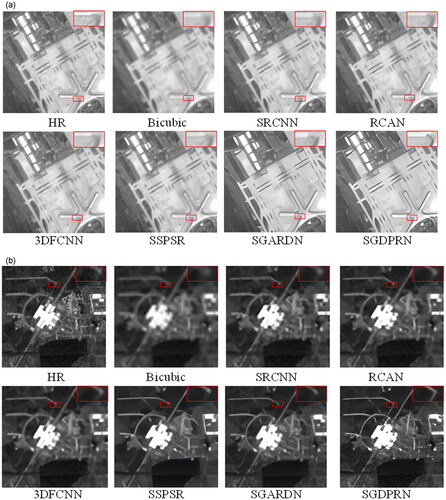
Figure 6. Spectral profiles of various methods on the large building dataset. (a) Shanghai, China and (b) Hong Kong, China.
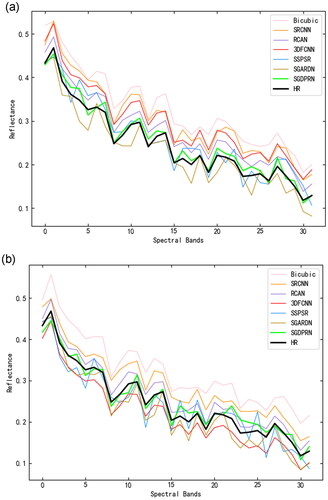
Figure 7. Visualization results for the small building complex dataset. (a) Shanghai, China and (b) Hong Kong, China.
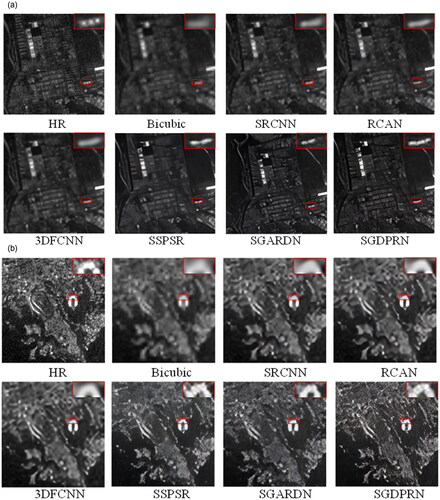
Figure 8. Spectral profiles of various methods on the small building complex dataset. (a) The mouth of the Yellow River and (b) Haikou, Hainan Province.
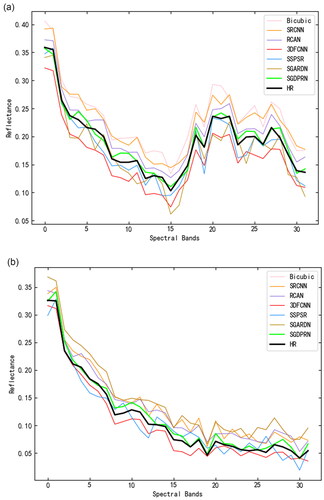
Table 3. Quantitative comparison of different methods for small building complex datasets.
Figure 9. Visualization results for the natural environment dataset. (a) The mouth of the Yellow River and (b) Haikou, Hainan Province.
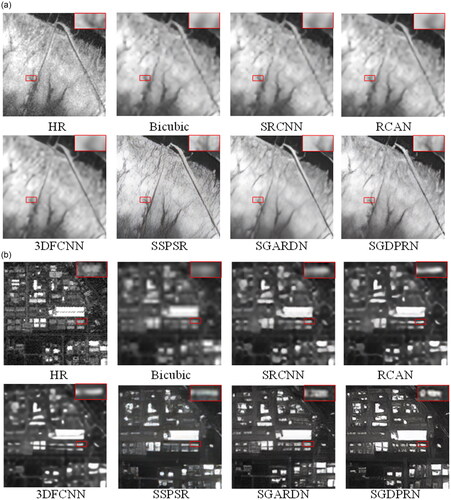
Figure 10. Spectral profiles of various methods on the natural environment dataset. (a) Number of model parameters and reconstruction performance and (b) Model runtime and reconstruction performance.
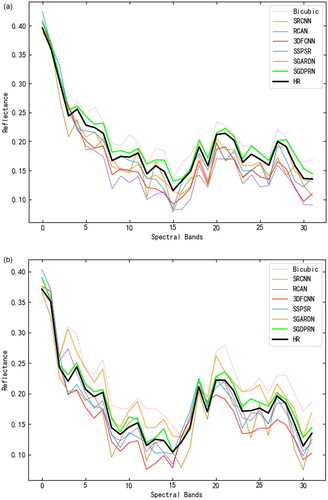
Table 4. Quantitative comparison of different methods for natural environment datasets.
Figure 11. Reconstruction performance of different methods. (a) relationship between the PSNR and the number of model parameters. (b) relationship between the PSNR and the model running time.
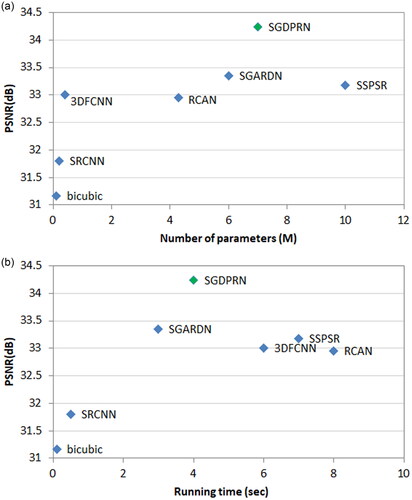
Table 5. Ablation study of the proposed modules on the large building dataset.
Data availability statement
Some or all data, models, or code generated or used during the study are available from the corresponding author by request.