Figures & data
Figure 1. Example of debris-covered valley with permafrost polygons, they are seen as the brown debris mounds with the white snow/ice around circling them next to each other, circled in orange is an example of one of these polygons.
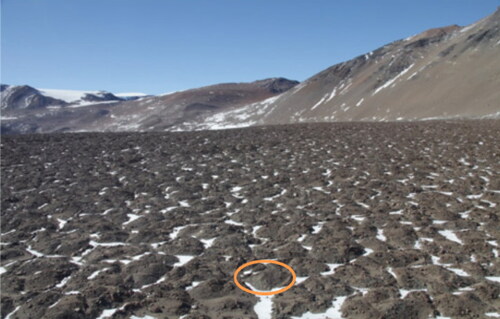
Figure 2. Digital Elevation Model (DEM) (1 m resolution) of the Ong Valley. The Argosy Glacier is labelled at the SE of the Ong Valley.
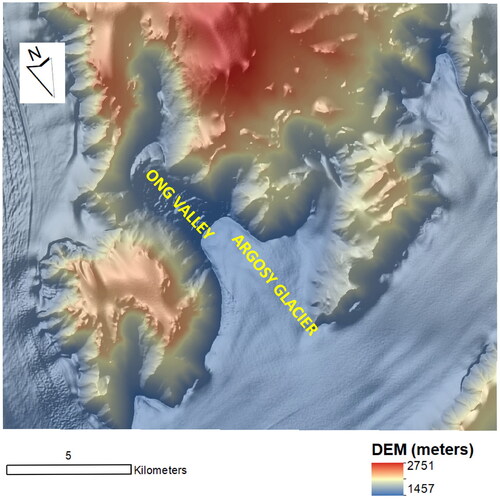
Figure 3. Locations of the Transarctic mountains (study area, black polygons) in the Antarctica. The background colored map (blue to red) is the Digital Elevation Model (DEM) with hillshade on top (70% transparency) at 7900 m resolution.
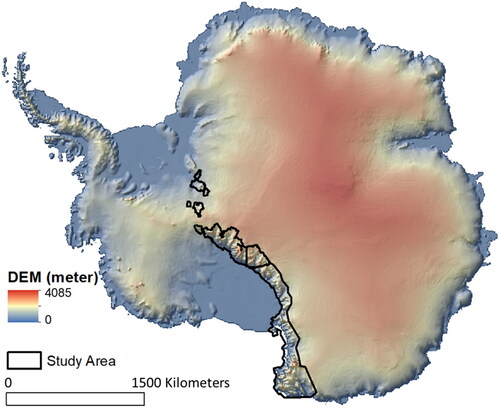
Figure 4. Demonstration of the buried-ice and ice free area detection in the Ong Valley: a) high-resolution satellite imagery of the Ong Valley (false color RGB composite of band 4 (NIR), band 3 (R) and band 1 (B), b) a subset of Fig. 4a showing salt and pepper texture (upper box in Fig. 4a), c) a subset of Fig. 4a showing salt and pepper (lower box in Fig. 4a.), d) a high resolution digital areal photo by USGS, e) a subset of Fig. 4d showing salt and pepper texture, f) DEM (1 m resolution) of the Ong valley, g) an elevation profile along AA’ line shown in Fig. 4f, and h) an elevation profile along BB’ line shown in Fig. 4f.
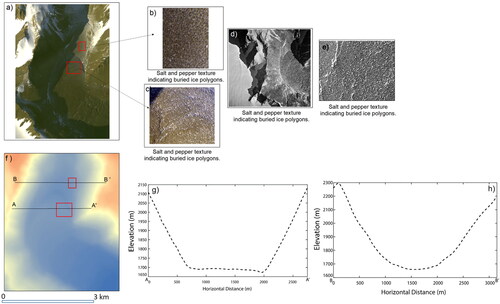
Figure 5. An example showing the impacts of azimuth angles (North facing vs West facing) on the occurrence on buried-ice and ice-free valley. Top panel shows the buried ice occurrence in a west facing valley using satellite image (a), 1 m resolution DEM (b) and elevation-profile along AA’ line (c) while the bottom panel shows the ice-free ares in a north facing valley using satellite image (d), 1 m resolution DEM (e) and elevation-profile along AA’ line (f).
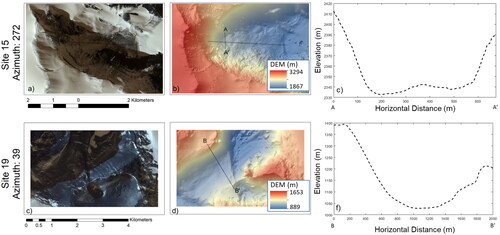
Figure 6. Locations of the detected buried ice sites: (A) Locations of the Transarctic Mountains, (B) Locations of detected potential buried ice sites using the methods demonstrated in and are shown in black triangles within the Transarctic Mountains.
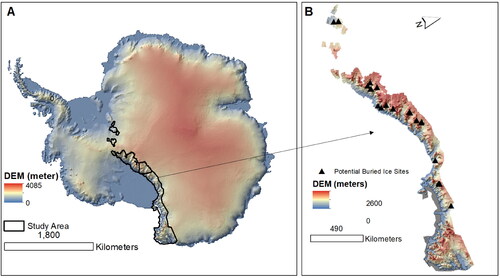
Table 1. Sites with potential buried ice, including two previously known sites: Beacon Valley and Ong Valley.
Figure 7. Aspects of all the valleys that were studied.
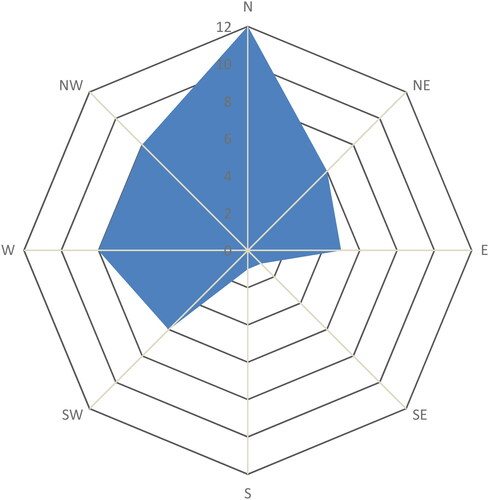
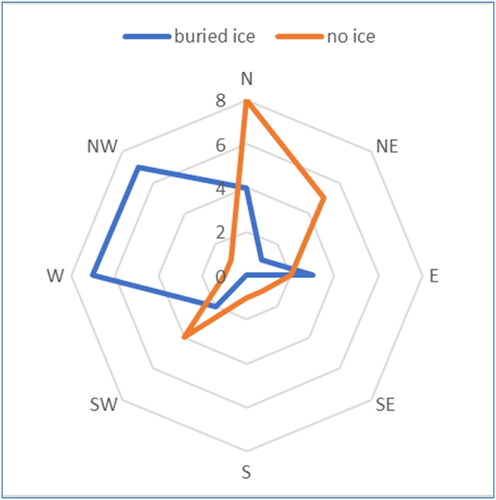
Figure 8. Aspects of the valleys that are ice free and valleys that potentially contain buried ice.